Like all of us, the older I get, the more I understand the genetics lessons I learned in high school biology. As a kid, I would sit at the dinner table every night and listen to my father tell his same favorite stories over and over again, laughing harder each time he told them. I have had similar experiences as an adult sitting around a board room table with him. However, now that I sit at the head of the dinner table every night, I catch myself laughing hysterically at my favorite stories about childhood, or college, or the first year of marriage, or my kids first few months, or any other period endearing to me, while my kids stare at me with a look that implies that the story is not really any more funny than the last time I told it.
One of my classic go to stories is about me and my wife’s family finances the first year of marriage. I was twenty-one when we married and had just graduated from Mississippi State with a Bachelor’s Degree in Accountancy two weeks before. I had plans to begin working on a Master’s of Professional Accountancy Degree at State the week after our wedding so I could achieve the hours I needed to sit for the CPA exam and ultimately join PricewaterhouseCoopers in Memphis, where I had accepted a job pending these requirements the semester before. My wife was about to start her senior year at Mississippi University for Women, and we cut our honeymoon in Jamaica a couple of days short (still the dumbest mistake I have ever made) so that we could hurry back before we missed too many days of summer school in pursuit of our ultimate educational goals.
That year and a half until we both ultimately graduated (at this point in the story my wife usually likes to remind me that I could not let this second graduation be enough and that she ultimately had to support me through three more years of law school before I decided to finally earn a living), we lived off of a small stipend I received as a graduate assistant at State, a humble paycheck my wife pulled in from a job on campus at the W, and I’m sure the occasional parental gift. My punchline to this story, which changes very little each time I tell it, is that “I promise we had more money then than we do now!”
The good thing about this story is that I often find a different audience to hear it each time so that it doesn’t get stale to anyone else except for my wife. Another good thing about it is that it always generates a laugh because whomever I tell it to often relates to it very well. As a matter of fact, I told it to a banking friend last week who agreed wholeheartedly that financial times seem much easier earlier in marriage than they do in mid-life. Why is that? It certainly is not because of income levels because my wife and I would have been lucky to earn $20,000 that first year. I never actually state the reason for this paradox, but I never have to because everyone knows why it is true. We were financially more secure early in married life because of the bottom part of our family income statement and not the top. As long as we scraped up enough cash to pay rent, the electric bill, and the occasional grocery bill, we could blow the rest however we chose. Things such as house maintenance, car payments (we still drove cars paid off by our parents as high school graduation gifts), tuition, retirement savings, kids’ clothes, baseball registration fees, etc., were too far in the distance to concern us.
Community banks are striving incredibly hard these days to increase the top line of their income statement, especially considering the way margins have compressed since the Great Recession. However, what if the same dynamic we all experienced as young married couples or young people in general also applied to community banks? What if the ultimate differentiator between higher earning community banks and lower earning community banks over the last five years was most related to their ability to control expenses instead of their ability to generate revenue?
We discussed in the previous articles how the Uniform Bank Performance Report (“UBPR”) data since 2010 indicates that smaller community banks have not necessary performed that much worse than their larger peers with regards to earnings, and as a matter of fact in many cases they performed better. We have also illustrated that the largest differentiator in bank earnings over that period of time seemed to be the location of the bank (i.e., urban v. rural) instead of the size of the bank, and that urban banks appeared to be at a disadvantage to rural banks when you consider their average ROE and ROA over the last five years. In the last article, we identified problem assets and loan provisions as part of the reason for that dynamic; however, a deeper look into the UBPR data indicates that operating expenses were much more responsible for the drag on urban banks than anything else.
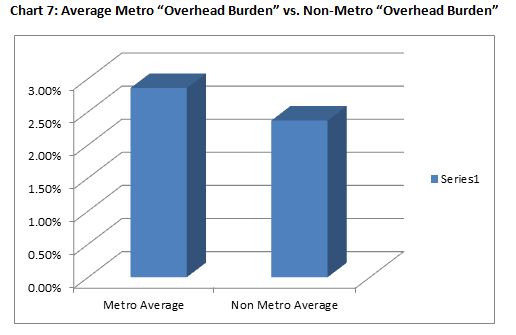
When you look at the average Overhead Burden for banks over the last five years (i.e., non-interest expense less non-interest income), metro banks carried 49 basis points more of overhead as a percentage of total assets than non-metro banks. This means that, all other things being equal over the last five years, metro banks would have had to generate 49 basis points more of yield on their total assets through net interest income or securities gains in order to average the same ROA non-metro banks earned considering their lower overhead burden. As we have already discussed before, though, that did not happen.
Chart 7: Average Metro “Overhead Burden” vs. Non-Metro “Overhead Burden”
 So why do metro banks spend more? Well, part of the reason may be tied to their large number of branch facilities which may be necessary to maintain market share in a larger market. According to that same data, banks in peer group categories with “more branches” had an average overhead burden to total assets of 2.79%, while banks in peer groups with fewer branches averaged a burden of 2.43%. Obviously, this would increase the costs related to occupancy and equipment, explaining why metro banks occupancy costs were higher than non-metro banks occupancy costs over that period (i.e., 0.44% average to total assets compared with 0.34% average to total assets) and banks with “more branches” carried higher occupancy costs as well (i.e., 0.45% compared to 0.33% for banks with “fewer branches”). Metro banks also averaged much higher “other expenses” (i.e., non-interest expenses excluding personnel and occupancy and equipment) than their non-metro counterparts (i.e., 1.28% on average to total assets relative to 0.97% for non-metro banks), and continuing with the theme that numbers of branches were the driver, banks with “more branches” averaged other expenses of 1.18% to total assets compared to an average of 1.07% for banks with “fewer branches.”
Possibly the most interesting differentiator appeared to be personnel expenses. Metro Banks and banks with “more branches” both averaged 1.77% of personnel expenses to total assets over the last five years compared to non-metro banks and banks with fewer branches that both averaged 1.57%. However, contrary to the logical progression from the previous paragraph, this did not appear to be caused by the fact that metro banks had “more branches” and therefore more employees to staff additional offices. As a matter of fact, metro banks actually averaged slightly less assets per employee over the last five years (i.e., $3,910,000) than non-metro banks ($3,990,000), even though banks with “more branches” averaged much less assets per employee (I,e,$3,390,000) than banks with “fewer branches” (i.e., $4,510,000). Therefore, relative to assets, there was not much difference between the number of employees for metro banks and the number for rural banks, even though there was a big difference between banks with “more branches” relative to banks with “fewer branches”.
Then why are metro banks carrying so much more personnel expenses as a percentage of total assets than their rural counterparts? They are paying each person they employ more. On average over the last five years, metro banks paid each employee $64,850 while their non-metro counterparts paid $58,160 per employee. While that doesn’t sound like a big difference on its face, you multiply that $6,690 times fifty employees and you start to get to some real numbers.
Why are metro banks so generous? Well, if I had to guess, they are not paying it out of the goodness of their heart. Logic tells us that costs of living in metropolitan areas are higher, and that employees of banks in that area would demand a higher pay check to pay the bills, so maybe metro banks have to pay those larger paychecks just to compete for necessary staff in those areas. It is hard to prove this just by looking at UBPR data, so any such conclusion is just a guess. I know one thing, though. That first year of marriage sure would have been a lot harder in New York City than it was in Starkville, Mississippi.