We all know the story and ultimate conclusion, right? Commercial banking is becoming more complex, regulations are multiplying exponentially each passing day, commercial activity and related loans are migrating more and more to metropolitan areas, so therefore small town, community banks are quickly becoming a thing of the past. They simply can’t keep up. Not only are they losing loans to banks in faster growing, more populated areas, but they also are struggling to hire sufficient staff to comply with regulation, much less chase loans. They just don’t have the economies of scale or markets to support the inevitable overhead explosion and attract the top talent to their slow growing, rural economies. Sadly, their days are numbered. Within a decade or two, rural community banks with assets less than $1 billion will go the way of the dinosaur, victims of that terrible meteor named Dodd-Frank.
This must be the truth, right? Everything we learned in macroeconomics demands it. Bigger banks have more economies of scale to support the rising fixed costs associated with commercial banking, and smaller banks will eventually tap out. Metropolitan banks have more access to capital, loans, and growing deposit bases and therefore have an inherent advantage over their rural cousin the country bank. As a former CFO and COO of a rural, community bank, I know I bought it hook, line, and sinker. Looking at growing overhead, shrinking loans, and aging management, I was convinced this storyline was the only possible one. Heck, it’s a big reason why I decided a future in community banking was not for me, opting instead to return to the much more stable world of practicing law (note the presence of my tongue which is firmly implanted in my cheek).
The problem is, five years after the end of the great recession, the bank statistics published in the Uniform Bank Performance Reports (“UBPR”) by the Federal Financial Institutions Examination Council (“FFIEC”) simply don’t support this idea that small town community banks are dead, or that they are even dying. As a matter of fact, there is some argument to the contrary, at least in certain contexts.
In reaching this conclusion, I examined the UPBR average peer group data from the last five years for each of the 15 major peer groups for insured commercial banks. I excluded the peer groups related to De Novo banks created in the last five years which had the potential to skew the analysis due to the unique challenges faced by De Novo institutions. These 15 different peer groups, which included 5,619 banks, are delineated as follows:
| Peer Group 1: Insured commercial banks in excess of $3 billion |
| Peer Group 2: Insured commercial banks between $1 billion and $3 billion |
| Peer Group 3: Insured commercial banks between $300 million and $1 billion |
| Peer Group 4: Insured commercial banks having assets between $100 million and $300 million, with 3 or more full service banking offices and located in a metropolitan statistical area |
| Peer Group 5: Insured commercial banks having assets between $100 million and $300 million, with 3 or more full service banking offices and not located in a metropolitan statistical area |
| Peer Group 6: Insured commercial banks having assets between $100 million and $300 million, with 2 or fewer full service banking offices and located in a metropolitan statistical area |
| Peer Group 7: Insured commercial banks having assets between $100 million and $300 million, with 2 or fewer full service banking offices and not located in a metropolitan statistical area |
| Peer Group 8: Insured commercial banks having assets between $50 million and $100 million, with 3 or more full service banking offices and located in a metropolitan statistical area |
| Peer Group 9: Insured commercial banks having assets between $50 million and $100 million, with 3 or more full service banking offices and not located in a metropolitan statistical area |
| Peer Group 10: Insured commercial banks having assets between $50 million and $100 million, with 2 or fewer full service banking offices and located in a metropolitan statistical area |
| Peer Group 11: Insured commercial banks having assets between $50 million and $100 million, with 2 or fewer full service banking offices and not located in a metropolitan statistical area |
| Peer Group 12: Insured commercial banks having assets less than $50 million, with 2 or more full service banking offices and located in a metropolitan statistical area |
| Peer Group 13: Insured commercial banks having assets less than $50 million, with 2 or more full service banking offices and not located in a metropolitan statistical area |
| Peer Group 14: Insured commercial banks having assets less than $50 million, with 1 full service banking office and located in a metropolitan statistical area |
| Peer Group 15: Insured commercial banks having assets less than $50 million, with 1 full service banking office and not located in a metropolitan statistical area |
As of December 31, 2014, the average number of banks per peer group was 374.6 banks. The largest peer group by far was Peer Group 3 (i.e., banks between $300 million and $1 billion), which included 1,254 banks. The smallest peer group was Peer Group 12 (i.e., banks less than $50 million located in a metropolitan area and having 2 or more full branches), which contained 63 banks. The median peer group was Peer Group 2 (i.e., banks between $1 billion and $3 billion) with 321 banks.
This UBPR data separates banks into peer groups that distinguish them not only on the basis of size, but also based upon the number of full service branches operated by a bank as well as whether the bank is located in a metropolitan or non-metropolitan area. For the purposes of clarification, it is important to note that a bank may be classified as a non-metropolitan bank and still have full service branches in a metropolitan area, and vice versa. For example, a $150 million commercial bank whose main office is in a non-metropolitan area but who also operates another full service branch in a metropolitan area is part of Peer Group 7, which includes banks between $100 million and $300 million of assets that have 2 or fewer branches and are not located in a metropolitan area. Therefore, it is the main office location of the bank that controls and not the location of its branches. For the purposes of the UBPR, a metropolitan area is one classified as a Metropolitan Statistical Area by the Office of Management and Budget.
I first stumbled upon the truths presented by the UBPR while I was analyzing the performance data of a client. With the same prejudices in mind that I stated in the opening two paragraphs, I decided to compare that bank’s data to statistics for banks in “larger” peer groups. What I discovered astonished me and interested me to the point that I decided to dig deeper. Not only did the bank’s statistics compare more favorable to the data of “larger” peer groups than it did to statistics of its own peer group, but the average numbers for the bank’s peer group 7, which is assigned to relatively smaller, rural banks, seemed to soar well above some of its larger, more metropolitan cousins.
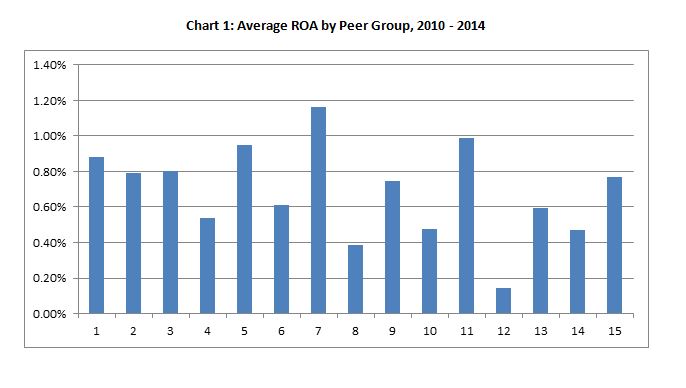
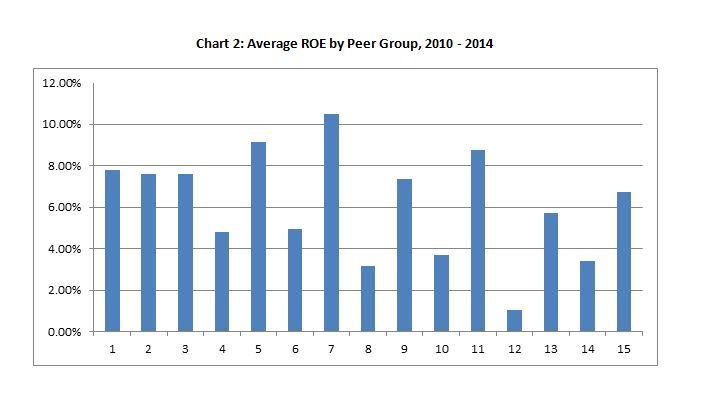
Peer group 7, which, as mentioned above, is reserved for banks between $100 million and $300 million in assets that are located in a non-metropolitan area and have 2 or fewer branches, averaged the highest Return on Equity (“ROE”) (i.e., 10.47%) and Return on Assets (“ROA”) (i.e., 1.16%) of any peer group over the last five years. What about the next highest ROE and ROA? Well those belonged to “rural, community” banks as well. Peer Group 11 (i.e., $50 million to $100 million, 2 or fewer branches, and non-metropolitan area) boasted the next highest ROA of 0.99%, and Peer Group 5 (i.e., $100 million to $300 million, 3 or more branches, and non-metropolitan area) claimed second place in ROE with 9.12%. Third place in each category also belonged to Peer Groups 11 and 5, just in reverse with respect to the category. Peer Group 1, the peer group for the nation’s largest banks (i.e., more than $3 billion in assets), doesn’t show up on either list until you look down to fourth place, where it finished with an average ROE of 7.79% and an average ROA of 0.88% over the last five years. In my next post, we will start to examine what could be the explanation of this and what secrets it could reveal to you regarding operating a community bank in this challenging environment.