• Skip to primary navigation
  • Skip to main content
  • Skip to primary sidebar
Brunini Law
Menu
  • About Us
      • Firm Overview
      • Diversity Matters
      • In the Community
      • Pro Bono
      • Legal Networks
      • Brunini, Grantham, Grower & Hewes, PLLC, founded over one century ago, today is one of Mississippi’s largest and most respected law firms. Our Firm’s practice is organized into three major areas of concentration: Commercial, Litigation and Regulatory law. Whether in a courtroom or the boardroom, we treat our client's business as we would our own.
    Close
  • About Us
  • People
      • Attorney Directory
      • Attorney Search
      • As one of Mississippi's oldest law firms, many of our attorneys have unmatched experience in industry sectors ranging from Energy to Telecommunications - from Litigation to Cyber Security.
    Close
  • People
  • Practices
      • Commercial
      • Litigation
      • Regulatory
      • The practice of law at Brunini is diverse, comprehensive and sophisticated. The scope of our services is coordinated across clients, industries and issues. The Brunini Firm is organized into three major areas of concentration that function optimally within the context of the law itself: Commercial, Litigation and Regulatory.
    Close
  • Practices
  • Careers
      • Recruiting
      • Summer Associates
      • Diversity
      • The Brunini Firm recruits new quality attorneys to meet its clients' increasing demands. The Firm interviews at a number of law schools and has an active summer clerkship program which is an integral part of its overall recruiting effort. We also recruit experienced attorneys with proven abilities and particular expertise to help us meet our clients' specific needs.
    Close
  • Careers
  • News
      • News
      • Coronavirus Updates
      • Blog
      • Recent Experience
      • Rankings & Awards
      • Newsletters
      • Newsletter Signup
      • Check here often for firm news, blogs, rankings and awards, and other recent developments involving Brunini and its lawyers. You can also review recent firm newsletters here and sign up to receive the newsletters by email.
    Close
  • News
  • Office
      • Jackson
      • P: 601-948-3101
        190 East Capitol Street
        The Pinnacle Building, Suite 100
        Jackson, MS 39201
    Close
  • Office
    • Jackson
    • Close

Banking

Three Takeaways from the Recent Settlement in CFPB v. BancorpSouth

July 22, 2016 by Brunini Law

There were many things from the recent settlement of Fair Lending and Fair Housing Claims against BancorpSouth that didn’t surprised me (see United States of American and Consumer Financial Protection Bureau v. BancorpSouth Bank, Case No. 1:16cv118-GHD-DAS, U.S. District Court for the Northern District of Mississippi, Aberdeen Division).  I was not surprised that BancorpSouth settled a Fair Lending investigation since it had been fairly well known that the bank was undergoing an investigation that had put on hold its regulatory applications for two planned bank acquisitions.  I also was not surprised that a Mississippi bank was the subject of such an investigation since Federal regulators have long utilized Mississippi’s tortuous and inescapable past as a reason to plow its fertile ground and harvest a rich political yield in the form Fair Lending investigations.  This regulatory tendency has existed at least a decade, going back to when the FDIC started sending Mississippi banks nasty letters about their HMDA data.  There were three big points worth noting, though, some of which were concepts I already knew but had reinforced by the settlement.  Others, however, were eye-opening revelations.  Below is a description of each.

  1. HMDA Data Matters

I have never represented BancorpSouth on this or any other matter so I don’t have any knowledge of how this investigation began or what exactly triggered it.  However, by reading through the lines in the complaint, there are too many references to “regression analysis,” “statistically significant” rate differentials, and the Memphis MSA to not think that it may have begun as a review of the bank’s HMDA data from Memphis.  That is just a guess, but based on prior experience, it seems to be a good one.  The way these things typically play out, the Feds, after sticking their statistics geeks in the corner with a bank’s HMDA data, find that there are statically significant differentials as to interest rates charged or denial rates for minority borrowers relative to non-minority borrowers.

Their questions start out benign at first, asking whether these differentials can be explained by business non-discriminatory reasons.  What they are looking for is for you to provide them a rate sheet, loan policy, or some other objective measure that shows why the mortgage borrowers were charged a certain rate on a certain loan or why a minority borrower was denied credit.  If they select a sample of loans and find that the rates charged followed closely a standard rate sheet used to price mortgage loans, or if denials of minority applications were the result of the applicant clearly not meeting objective credit standards stipulated in their loan policies, and those factors were carefully documented in the file as the reason for the decision made by the loan officer, the regulators will conclude (hopefully) that the “statistically significant” differences were caused by other non-discriminatory factors and move on to their next prey, I mean bank.  However, if they take a sample to test, and in the process cannot find any objective reason for why minority borrowers would be treated differently, the bank that is the object of the investigation had better hold on; it is going to be a bumpy ride!  This leads me to my second point . . .

  1. Underwriting Discretion is the Fair Lending Death Nail

I am the son of a community banker.  Like all of us, I remember asking my dad one time when I was small why he decided to pick his career.  His dad became a banker later in life, and both of my dad’s older brothers are bankers, so his choice was not a novel one.  Family influence, though, was not the reason he gave.  Instead, my dad believed that, as a community banker, he had the opportunity to help people meet the needs of their businesses and families.  Of course, one of the greatest tools a community banker has in his or her toolbox to pursue this divine calling is good common sense to exercise reasonable discretion when warranted.  Not only does it assist the community banker in pulling that customer out of a tough financial place in life, it also allows the community banker to compete with larger, less flexible institutions that have a tremendous advantage when it comes to economies of scale, especially in today’s compliance environment.

That tool now, though, has become the regulator’s number one enemy.  When it comes to Fair Lending, discretion is a four letter word, especially as to HMDA reportable loans.  If your bank’s LAR reveals that rates paid by minority borrowers or women are slightly higher on average than the control group, and they discover that your loan officers have the discretion to assign to borrowers whatever rates they, in their professional opinion, deem appropriate, your bank is presumed to be guilty of discriminating against minority borrowers until you somehow prove yourself innocent.  This all but forces banks to standardize their pricing and credit decisions, turning consumer credit into a commodity and erasing any competitive advantage community banks may have on such loans over their larger brethren that see the borrower as another number.  Unfortunately, what regulators don’t realize is that the one who really suffers is the borrower, black or white, who just needs a break to get over that next financial hurdle.  After all, you don’t receive any compassion from a loan policy or a rate sheet.

  1. The CFPB is Taking No Prisoners

I’m sure no one was shocked that the CFPB would aggressively pursue fair lending enforcement, especially among those banks that are larger than $10 billion in assets and within the wheelhouse of their examination authority.  There is a reason why that threshold was a big deal during the Dodd-Frank negotiations.  I was flabbergasted, though, by the lengths they went to in order to satisfy their appetite for a trophy kill.  Secret recordings of lower level management meetings and spies sent into branches in markets totally unrelated to where the original problems were found are just two examples of that.  This was not a regulatory investigation; it was a James Bond novel.  Apparently, the CFPB has inherited the playbook of the KGB.

Not only that, but in a settlement that was supposedly negotiated, they felt compelled to include in the complaint unnecessary and embarrassing quotes from their secret recordings just to rub salt in the wound.  I can only hope that waterboarding was not used to convince the bank to accept the complaint’s content.

Make no mistake, the CFPB is on a war path, and it is scalps, not justice, that it is after.  As an agency that is still trying to prove its worth and fend off political and judicial challenges to its constitutionality and unfettered administrative authority, the CFPB is more worried about justifying its existence than protecting its charge, the American consumer.  What will happen to American consumers, though, much less our financial system, when the CFPB scares half of our community banks into ending consumer lending all together and assaults the reputation of the other half until their safety and soundness is compromised?  They will be forced into the arms of industries much less regulated and unconcerned about their wellbeing, I’m sure.  This case may be the best illustration yet of what happens when you separate the consumer regulator from the prudential one.


Five Things I Learned at Disney World

March 23, 2016 by Brunini Law

Last week, during my kids’ spring break, we finally took our epic family trip to Disney World (yes, I am the tightwad father that refused to take them until they were old enough to remember it because I didn’t want to “waste” the trip). We did it right, too. Instead of fooling with airports and all the unnecessary convenience they bring, we drove the whole way, 20 hours round trip, Clark Griswold style. It is sufficient to say that between that and the lines at Disney, we all received adequate practice in the development of that most wonderful virtue of patience.

I didn’t just take the week off, though. From the moment we passed under those storied gates to the tortuous wait for the final monorail with 100,000 of my closest friends at 11:30 pm on our final night, I observed several interesting facts and trends that will be tremendously useful in providing advice to my banking clients. Below are five of those lessons that I thought may be worth your time to consider.

1. The Debit Card is Dead (or At Least Will Be Soon)

Nobody who is anybody at Disney pays for anything with a debit card. For those that are staying at the resort, stylish wrist bands are the preferred form of payment. These wrist bands, which apparently come in an array of colors and styles, store all kinds of information about the Disney patron they belong to. This includes payment information, which means that paying $50 for a $10 meal can be as easy as waiving your wrist in front of pay terminal, but it also includes your reservation to ride Space Mountain at 9:15 pm without having to wait in line for an hour and a half, as well as your ticket into the park. It is your all in one golden ticket for everything Disney (as well as Disney’s golden ticket to all of your valuable personal information and preferences).

Of course, my children had the Dad that decided to use points for a hotel stay “off resort” instead of springing for five nights at the Polynesian, so they did not get to sport one of these trendy “Magic Bands.” However, their prevalence could not be avoided, along with the obvious enthusiasm with which they were embraced. A few times I pulled out a debit card to pay for light sabers or food and the attendant looked at me like I had just pulled out a check book. Obviously, Disney is still an isolated environment and the infrastructure it has in place has not yet been replicated throughout our broader economy, but the outcome to me appears inevitable. As trusting as we now seem to be of technology and as much as we welcome its convenience, the days of the uni-purpose debit card that merely allows access to your checking account are numbered. The alternative form of payment device, whether it be a pretty wrist band or an iPhone, that not only allows access to your checking account but also stores all of your personal information so that retailers can cater to your every stored preference is fast approaching, whether the law is ready for it or not.

2. Branding Success Does Not Mean Branding Complacency

This was the first time I visited Disney World since I was twelve, and while I do not remember everything about that trip, I remember enough to recognize that this experience was very different. Unlike a quarter of a century ago, I did not spend my time waiting in line to see Mickey Mouse or Donald Duck; instead I waited an hour to see Chewbacca and Kylo Ren. Whereas my last trip I rode “Mr. Toad’s Wild Ride,” this time my eight year old made me ride Buzz Lightyear’s shooting gallery numerous times.
There is no question that Disney is the king of branding, which has helped them develop and maintain a tremendously loyal following that still brings untold millions to their parks every year in what can only be called an American cultural pilgrimage. Let’s be honest, no one above 25 goes to Disney World because it is “fun;” they go because it has become such a rite of passage for children that those who do not take their kids are subject to a visit from DHS for mistreating their offspring. It is that irresistible brand which lead me to spend St. Patrick ’s Day walking untold miles while being run over by numerous mothers wearing green and pushing strollers (one of which who wore a shirt that proudly said “I’ll Shamrock Your World”).

That being said, the brand Walt Disney made famous 80 years ago is not the same brand that continues to make $100 a head off of those obnoxious green crowds today. While you still see Mickey Mouse and Donald from time to time, you come in contact possibly more frequently with talking toys and Jedi Knights. Disney’s brand has evolved. Instead of resting on the laurels that brought them incredible success, they continue to look for ways to make their brand relevant to new generations, and it is working. If you doubt their success, just ask movie attendants about the costumed crowds they had to manage this past Christmas and the millions of dollars they paid to get a glimpse at an aging Harrison Ford. However, Disney has not forgotten its original charm, and it still uses that legacy brand as well, which was evidenced by the way my eight year old’s eyes lit up both times he rode “It’s a Small World.” Their ability to improve a brand without destroying it is one to be envied and modeled.

3. Expectation and Perception are the Keys to Customer Service

While Disney’s branding is second to none, its crowd management is still a work in progress. Waiting an hour and a half for a minute and a half ride can really take it out of you. However, I noticed that my level of patience varied dramatically depending on how long they estimated the wait to be. When the estimated waiting time for the “standby” entrance to a ride was 90 minutes, I was thrilled when I only had to wait 60; however, when another ride estimated a waiting time of 35 minutes, I was fighting mad when that same 60 minute wait became a reality. I have always heard that you should under-promise and over-deliver when it comes to customer service and not the other way around. Disney is a very tangible expression of that truism.

In order to better manage crowds, Disney has developed something called the “Fastpass” which allows patrons to reserve preferred treatment in waiting lines for three separate rides at one park each day. The rules for the application of the concept are somewhat cumbersome and confusing, but the idea makes sense: spread out crowds at different times during the day in order to shorten wait times for everyone. The biggest problem is that everyone usually wants to ride the same three rides, so the bums who did not get their “Fastpass” reserved in time have to sit in line and watch the chosen ones pass easily to the front of the line. In theory, we all had the same opportunity to secure those reservations, but that didn’t help my feelings a bit when my child had been hanging on me and whining for the last 45 minutes and I had to watch a 19 year old and his girlfriend walk by me just by waiving their pretty wrist bands in front of a terminal until the Mickey Mouse outline turned green. Therefore, my suggestion for Disney, or any other customer service representative, is this: always over-estimate the amount of time that I am going to have to wait for your service, and if someone is jumping ahead of me, you had better not let me know about it, even if I had the same chance earlier and chose not to take it.

4. Sometimes You Just Have to Start Over

As Daddy’s reward for waiting in those long lines, we also decided to take in some Spring Training baseball while we were there. For those of you who don’t know, the Atlanta Braves Spring Training home is at Disney World, and this provided a much needed reprieve from the exhausting hustle and bustle of the Magic Kingdom. I and my youngest son are Braves fans, and we had an opportunity to watch them tie (unfortunately no free baseball in Spring Training) my oldest son’s favorite team, the St. Louis Cardinals. Incidentally, my oldest son was raised a Braves fan but unfortunately jumped ship (somewhat understandably) when the Braves decided to trade or run off every player he had ever known. He instead decided to proudly wear Cardinal colors and bask in the glory of 100 wins instead of hide from the shame of 95 losses.

However, while I constantly had my nose in the program looking up names of Braves players I have never heard of, I did notice that there was a lot of good, young talent on the field wearing navy blue. Not only that, but there seemed to be an energy and enthusiasm generated from so many optimistic minor leaguers looking for a job that you couldn’t help but feel that better days are ahead for the Braves. If you have followed the Braves like I have, you know that they spent at least a decade just above mediocrity holding onto the idea that what they had been doing for several years would ultimately bring them back to where they were in the 90s. To their credit, their management finally said enough, and they have decided to blow up a moderately successful model in hopes of achieving even greater success with unproven but incredibly talented prospects. Their ultimate destination is still unknown, but I don’t think there is any doubt that this was probably their only chance to again build lasting success. Baseball teams are no different from any other organization, including banks. Those who are happy with mediocrity can plod along with an outdated model, but to truly reach new heights in a changing environment, sometimes it is necessary to start all over.

5. We Must Continue to Dream

The dramatic success of Disney and everything it stands for is not an accident. It is directly related to the vision of its amazing creator, Walt Disney, who foresaw much more than a mouse on a piece of paper when he began the organization that has now become a cultural phenomenon, much less an American corporate giant. That vision lead to a corporate culture that fostered dreaming and dreamers and pushed the company to greater heights than its creator could have even imagined. Had Walt Disney, or his corporate heirs, ever allowed themselves to be motivated only by short time pursuits or quarterly earnings goals, the company would have never become what it is today. Dreamers may not be profitable every quarter, but their potential for greatness is much higher than pragmatists. Obviously both are needed, but they must balance each other, and one cannot be allowed to push the other to the side.

One aspect of Disney World that made an impression on me as a kid was the optimistic focus on the future and the possibilities it could bring. From Spaceship Earth at Epcot to Tomorrowland in the Magic Kingdom, my twelve year old sensibilities were fascinated by not only the amazing future the park imagined, but just how inevitable that future seemed to be. Maybe it was a difference in age and perspective, or the fact that my first visit was in the eternally optimistic 1980s while my most recent visit was during a much more pessimistic period of time, but for some reason, when I visited the park last week, those exciting views into the future seemed to be a retrospective window into past dreams rather than a thrilling prediction of future progress. It made me sad to feel that we, our companies and much worse our country, are losing the capacity to dream. When I was a kid, I spoke of becoming an astronaut often, but I rarely hear space discussed in my house these days unless it is in the context of “a long time ago in a galaxy far, far away.” Heck, our country doesn’t even have a space program anymore. I know that dreams and imagination are difficult to nurture in this age of Great Recessions / Terrorism / unbearable regulation / (insert current fear hear), but we can never allow our urge to defend against our worst fears impair our courage to pursue our wildest dreams. To do so would lead our lives, our families, our country, and our world to a fate worse than death.

Five Things I Learned as a Community Banker

January 21, 2016 by Brunini Law

In my last blog post, which I am ashamed to say was all the way back in May of last year, I concluded by noting that, between 2010 and 2014, a bank’s ability to control costs appeared to be more closely correlated to its earnings performance than its ability to grow interest income. I also stated that my next article would examine whether or not that correlation should hold in a rising interest rate environment. However, since it appears that interest rates will never again rise meaningfully (notwithstanding the Federal Reserve’s feeble attempt to start the process last month, one they may very well need to reverse soon the way 2016 is starting out), I decided to scrap that whole series altogether. Instead, I decided to start the new year with a different idea that will highlight five important ideas or facts about different subjects that I feel are important to community bankers (or maybe just important to me, who knows).

First of all, I must admit that I stole this idea from the Wall Street Journal who, from time to time, runs articles on “Five Things” ranging from interesting notes on that most revered pursuit of intellectual superiority known as the presidential race to reasons why J.J. Abrams had to kill off Han Solo (a development that I am still quite upset about). Luckily, my legal help is cheap, so if the Journal has a problem with me using their format, maybe it will all work out OK.

For my first article in the series, I plan to focus on five things I learned as a community banker that are still useful to me today. As a matter of fact, since they are so countercultural for many in my current profession of law, they may benefit me more now than they did when I was banking. Follow along and see how many of these traits community banking has conditioned into your character as well.

1. Always Call People Back As Soon As Possible

I know this one sounds simple, but you would be shocked to know (or maybe you wouldn’t) how many attorneys act like their voicemail doesn’t exist. Trying to get them to return a message is like trying to get your ten year old to give you change back after a trip to the concession stand; it just doesn’t happen. I’m not sure if they are scared of their phone, or if they are actually that busy, but either way, it is enough to drive you mad. Not that it is excusable, but I can somewhat see why they now refuse to return my calls since I am not their client but instead an attorney that is often representing an opposing viewpoint (even so, the undue delay does nothing but hinder their client’s interest). However, I am sad to say that I had the same experience when I was a community banker AND A CLIENT. Either most clients are much more patient than me, or those attorneys are so good it doesn’t matter. Regardless, community banking taught me that you must always return your phone calls. Not only does it prevent the bank down the street from fielding a subsequent call from that same person, but common sense tells you that it benefits you and your community reputation in the long run to respect the time and effort people put into trying to contact you. Since common sense is often in short supply in the legal world, maybe that is why bankers are just better at this.

2. No Job is Below Your Pay Grade

I must admit, one community banker comes to my mind as the embodiment of this lesson, and it is my father. Since I was a kid, I have watched him pick up paper in the parking lot of the bank while carrying the title of Chairman of the Board and Chief Executive Officer, a practice that he also exhibited several times while me, as his employee, failed to notice and walked right by the tootsie roll wrapper that he bent down to pick up. In the world of legal runners and billable hours, this just doesn’t happen unless it can be done for $235 per hour and itemized on some poor soul’s bill. However, I learned from my father that doing the small jobs that need to be done doesn’t just make you look more down to earth; it also places the needs of your organization above those of your own in order to make sure that it accomplishes its utmost potential. After all, as the organization rises, so do the prospects and aspirations of its members. Unless the organization prospers, though, the realized potential of the members making up that organization is limited by the weight of that underperforming organization. There are too many small jobs for the runners and administrative staff to do alone; some of them require non-billable hours now for a more profitable practice later.

3. Sometimes You Have to Wear More than One (Or Twenty) Hats

Don’t get me wrong, attorneys are great multi-taskers and are forced every day to juggle more than one file at a time. However, for some time now the phenomenon of professional specialization has taken a foothold within many law firms so that most attorneys limit themselves to one or two practice areas and rarely venture across the borders of those specialties for fear of having to touch base with their professional liability carrier. Community bankers, though, have never had that luxury. As a matter of fact, as regulation increases and the pool of qualified talent decreases, the thought of specialization is nothing more than a pipe dream for all community bankers, or at least those that want to survive the current super-competitive environment to fight another day. Truth be known, technology and competition is quickly changing the legal profession as well, and an obstinate adherence to strict specialization may not be possible for most attorneys much longer, either. Luckily, I had six years of community banking that taught me to wear more than just one hat.

4. People Don’t Really Care What You Know Until They Know You Care

It scares me sometimes to think about how many people I work with every day (both within my law firm and within other firms whose attorneys I work with on different issues) that have more impressive IQs and resumes than I do. As a profession that peddles knowledge, attorneys often place the highest premiums on intellectual talents while discounting bedside manner. However, while I was a community banker that tried to convince my attorneys that I just didn’t need that twenty-page memo regardless of how well it was researched, I realized that clients really can’t trust your knowledge until they can trust that you will use it in their best interest. The duty of loyalty to a client doesn’t just mean you put their needs above those of a third party; it also means that you must put their needs above those of your own, no matter how much you need billable hours or words of affirmation extolling your vast legal research skills. Unless your knowledge benefits your client, it is better to just keep it to yourself, especially when your hourly rate contains three digits.

5. Never Tell A Customer “That’s Not My Job”

While I was at the bank, there was a sweet old lady that would call me at least once a month to help her balance her check book. At first, this aggravated me. After all, my ego told me that I have a CPA and a law degree; surely such a menial task can be performed more efficiently by a customer service representative, or possibly even a teller. However, I later noticed that there were other customers that would walk into my dad’s office asking the same thing, and he never hesitated to help them out. I’m not talking about customers who were going to bring the bank a two million dollar loan from time to time. No, I’m talking about the 85 year old man that was trying to make sure his social security check would stretch until the end of the month. Eventually, it dawned on me that God gives us a calling for reasons other than to generate income in the most efficient manner; he also places us within a profession to help make the world a better place. Those who realize this don’t just earn a living, they also live out a calling that makes their work more rewarding. At the same time, that two million dollar loan customer is watching more often than not and takes notice of their character. Such character demands loyalty, and loyalty is always good for business.

So, there’s my list of the five most valuable things I learned as a community banker. I know for sure that it is not comprehensive, and there very well may be other more important lessons you have learned that I failed to mention. If so, please e-mail them to me at twalker@brunini.com. I would love to learn from your experiences as well.

* This Newsletter is a publication of the Commercial Department of the law firm of Brunini, Grantham, Grower & Hewes located in Jackson, Mississippi. This Newsletter is not designed or intended to provide legal or professional advice, as any such advice requires the consideration of the facts of the specific situation.

IRS Circular 230 Notice

To ensure compliance with requirements imposed by the IRS, we inform you that, unless specifically indicated otherwise, any tax advice contained in this communication (including any attachments) was not intended or written to be used, and cannot be used, for the purpose of (i) avoiding tax-related penalties under the Internal Revenue Code, or (ii) promoting, marketing, or recommending to another party any tax-related matter addressed herein.

Related Attorneys

  • Thomas E. Walker, Jr.

The Things We Missed While Daydreaming in College Statistics

May 26, 2015 by Brunini Law

While I love numbers and “statistics” in the baseball sense of the word, I must admit that I never sat through a class in college that I considered more worthless than Statistics. I never considered a regression analysis too hard to regurgitate on a test, but the necessity of it escaped me. Possibly it was my instructor who failed to adequately explain to me when such information could ever be worth the money my parents were paying for me to receive it, or possibly it was me who failed to pay close enough attention to him when he tried to do so (the latter is probably more likely than the former), but I could not in my wildest dreams ever foresee a time when that knowledge would have practical application to my personal or professional life.

Following college, I’m not sure the concepts I learned in statistics ever reentered my mind until I was a young lawyer and learned that Federal banking regulators were using regression analyses to decide whether or not banks were complying with Fair Lending laws. Evidently, they did not have the same college Statistics experience I did since they not only found that information useful but also considered it worthy of reliance as substantiation of the ultimate “Scarlet Letter” in banking known as discrimination. While I still consider that point debatable and often believe there are parallels between Fair Lending enforcement and “The Crucible” (I am full of college curriculum references today), I will say that age and Microsoft Excel have at least allowed me to find interesting uses for Statistics, even though their reliance may still be debatable.

For example, there is a function in Excel that allows you to calculate the correlation between one set of data points and another set of data points. You statisticians and regulators out there already know that the calculation of “r,” or “Person’s correlation coefficient,” is a measure of the linear correlation between two variables. This measurement is reflected through a value between -1 and 1, with a result of 1 meaning that the two data points are perfectly correlated in a positive way (i.e., as x moves, so does y), and a result of -1 meaning that the two data points are negatively correlated (i.e., as x moves up, so does y move down). A result of 0 implies that there is no linear relationship at all between the two data points, and a correlation of 0.80 and above is generally considered as statistically significant enough to indicate a linear relationship.

“My head is hurting,” you say. “I am not a regulator, so I can’t possibly see what any of this has to do with banking.” Well, as I implied above, Microsoft Excel has a formula function that allows you to calculate “r” for different data points. When I realized that, I thought it might be fun (or at least interesting) to analyze the linear relationships between varying bank performance ratios and the typical bank profitability ratios (i.e., ROA, Pretax ROA, and ROE) in order to see, for example, if a higher net interest margin for banks studied could be related to higher profitability for banks during a given period of time.      By using the same peer group data from the last five years of UBPR reports that I have referred to in all of my previous articles, I decided to try this. What I found was even more interesting than I thought it would be.

First of all, many of the bank performance ratios and statistics that are often presumed to be primary drivers of profitability appeared to have little correlation to ROA, ROE, or pretax ROA over the last five years. For example, consistent with my earlier articles questioning the benefits of size for banks, the average total assets for all peer groups between 2010 and 2014 had an “r” of 0.21 to ROA, 0.19 to ROE, and 0.32 to pretax ROA. If 0.80 is the standard for a statistically significant correlation, then total assets seems barely correlated to profitability at all. Another commonly held position is that a bank’s loans to assets drives profitability since it obviously increases the bank’s earning asset yields; however, loans to assets had a 0.01 r to pretax ROA, a 0 r to ROE, and actually a -.05 r to ROA, indicating no correlation to a slightly negative one.

So what about Net Interest Margin, the holy grail of community banking? How many countless hours are spent by bankers around Board and ALCO meeting tables wringing hands and thinking of some way to add one more basis point to a bank’s Net Interest Margin in order to improve bank profitability? Well, Net Interest Margin had negative correlations to each of the profitability measures, with a -.23 r to ROE, -.30 r to ROA, and a -.35 r to pretax ROA. As a matter of fact, if you compare those results to the correlation results for total assets, Net Interest Margin was more negatively correlated to profitability than total assets were positively correlated to the same.

So if size, loans, and Net Interest Margin were not correlated with bank profitability over the last five years, what was? I guess it shouldn’t be a surprise after the research I documented in my earlier articles that ratios dealing with a bank’s ability to control costs exhibited the strongest correlations during the period studied. For example, the ratio of other expenses to total assets was very strongly and negatively correlated with ROA, ROE, and pretax ROA (-0.86, -0.86, and -.84, respectively), indicating that profitability often went down as this ratio increased. Efficiency ratio exhibited the next strongest negative correlation, with an “r” of -0.83 to ROA,   -0.83 to ROE, and -0.84 to pretax ROA. A close third was bank Burden (i.e., non-interest expense less non-interest income), which had “r’s” to ROA, ROE, and pretax ROA of -0.77, -0.74, and -0.81, respectively. Notice that each of these “expense” centric measurements had correlation coefficients with negative correlations that were arguably statistically significant.

Chart 8: Correlation of Bank Performance Ratios to Profitability

CHART-FOR-BLOG

So what can we take from this, other than a bad reminder of college statistics? Probably nothing in and of itself since your college professors would tell you that “r” was never meant to predict causal relationships but instead merely indicate how two sets of data points may be linearly related; however, considering the evidence from my past articles, I’m not sure we can completely ignore it either. If nothing else, it seems to be further evidence of the fact that, at least during the last five years, a bank’s ability to grow or produce interest income was not nearly as important to the return their shareholders received as was the costs they incurred generating that extra dollar. The latter definitely seems like it was more harmful than the former was helpful. Would it be any different in an alternate part of the interest rate or economic cycle, though? After all, the last five years were most definitely unique in that historically low interest rates perpetuated through a historically tepid recovery. We will consider that point in my next article.

Community Banking: The Ultimate Moneyball

March 27, 2015 by Brunini Law

When I think about my childhood, the first and most vivid memory I have is of the summer before I turned 12. Although I didn’t realize it at the time, that summer was as close as I would ever come to realizing my dream of becoming a major league baseball player. That is because it was truly my only occupation, or obsession, for those three months. Each day, I would walk out of the house around 8:00 AM heading toward my friend Bill’s back yard, where I would play baseball with a “rag” ball (thank goodness considering how many houses and windows we hit) and my friends Chip, Clint, Jeff, Michael, and whomever else wandered up that day until the sun set and we were forced to go home. My specific job in the league, besides playing, was to serve as its official scorekeeper and statistician, which allowed me to combine my first love, baseball, with my second, numbers, in a way that still makes baseball appealing to me today. As each batter would come to the plate, I was duty bound to announce their season batting average as well as other pertinent statistics, such as how many homeruns they had hit off of the roof of the house next door. This love of baseball and numbers is still the reason I have to stay up until midnight watching “Moneyball” anytime I find it on cable at 10:30 P.M. It is also a trait I have passed along to my progeny, who keep the floors of our home covered with hundreds of baseball cards that they have sorted, studied, and stacked for hours like they had a final on Manny Machado’s slugging percentage the next day. Yes, my wife is an exceptional woman.

Because I love numbers, I subscribe to the philosophy that they don’t lie. However, I’m sure we are all familiar with Twain’s adopted view of statisticians, placing them on par with liars and the damned. Considering my love of numbers and my chosen profession, I’m not exactly comfortable about what such theories may imply about my character and my eternal prospects, Nevertheless, it would not surprise Twain to find out that the Federal Deposit Insurance Corporation (“FDIC”), after conducting an extensive study regarding issues facing community banks, reached a conclusion about the profitability of community banks relative to non-community banks that is contrary to many of the conclusions I have reached in recent blog articles.

To defend myself, before I discuss the FDIC’s conclusions, I think it is important to note a couple of important distinctions between the FDIC’s study and the research I have relied upon. First of all, that study adopts a completely different definition of community banks than the one I have relied upon. For the purposes of its study, the FDIC developed a new research definition of a community bank that was partially tied to asset size (i.e., an indexed maximum asset value that began at $250 million in 1984 and increased to $1 billion in 2010), but also considered “criteria related to traditional lending and deposit gathering activi­ties and limited geographic scope” (e.g., loans to assets > 33%, core deposits to assets > 50%, numbers of offices, and numbers of offices in MSAs and other states). My definition of a community bank for these articles, particularly my first addressing their competitive profitability, has been much more fluid and has been based solely on asset size.

Secondly, the FDIC’s study period of community bank profitability (i.e., 1985 – 2011), in addition to being primarily before the time period I considered (i.e., 2010 – 2014), was also more than five times longer. Therefore, it encapsulated many more market cycles than the data I studied. For that reason, some may argue that it is more reliable because it is more comprehensive; however, I think the counterargument would be that the last five years have been the most relevant for community banks to consider in this new world since they reflect life in the post-apocalyptic world following Dodd-Frank and the Great Recession.

Nevertheless, considering these differences, I thought it was important to address the following conclusions reached by Chapter 4[1] of the FDIC study, some of which were contrary to my analysis:

  • A comparison of pretax ROA[2] reveals that non-community banks (i.e., 1.31 % average pretax ROA) outperformed community banks (i.e., 1.02% average pretax ROA) during most of the FDIC study period;
  • Non-community banks had greater success in generating noninterest income from a variety of sources (i.e., average of 2.05 % of average assets vs. 0.8 % for community banks over that same period), explaining much of the gap in earnings;
  • Community banks, because of their heavy dependence on lending as a source of income and the long term trend toward lower net interest margins, also experienced a significant erosion in its traditional net interest income advantage over the last few years, which also contributed to the gap in pretax ROA; and
  • Even though community banks have traditionally been less efficient than non-community banks, this gap, as measured by the efficiency ratio, widened over the FDIC study period. While the gap was only 3.5% between 1985 and 1998, it ballooned to 9.2 % between 1999 and 2011. This was driven by community bank’s decreasing competitiveness in generating revenue along with their decreasing advantage from lower noninterest expenses, which is now almost non-existent despite a long-term noninterest expense advantage of 22 basis points.

That being said, there were also several points made in Chapter 4 of the Community Banking Study that supported conclusions I reached in my analysis. For example, for both community banks and non-community banks, banks headquartered in metropolitan areas had lower pretax ROAs than banks headquartered in nonmetropolitan areas. Community banks headquartered in nonmetropolitan areas averaged a pretax ROA of 1.25% compared with 0.94% for their urban counterparts, while non-community banks headquartered in rural areas averaged a very impressive pretax ROA of 1.88% compared to 1.30% for community banks headquartered in metropolitan areas. Therefore, the “city bank -country bank” dichotomy identified in my previous articles held up in the FDIC study as well. The FDIC study also noted that community banks have almost always incurred lower credit losses than non-community banks, which helped to narrow the overall earnings gap during the latter years of the study. Finally, with both sets of data, there is little argument that larger banks experienced a significant advantage with regards to net overhead and efficiency ratios.

Nonetheless, even the FDIC has concluded that that “while the results show that community banks may benefit from economies of scale, there is no indication of any significant benefit beyond $500 million in asset size, and much of the benefits from scale appear to be achieved for [community banks] as small as $100 million.” [3] Instead, the study reaching this conclusion found that community bank’s decreasing competitiveness with regards to efficiency ratios is more closely related to the growing erosion of their net interest income advantage and their inability to increase their assets managed relative to numbers of employees the same way that non-community banks have. So, once again, maybe size isn’t all that important, at least when you are talking about bank assets. However, the limited size of my buddy Bill’s yard was extremely important since it allowed me to entertain a dream of hitting similar grand slams in major league parks one day, at least for a summer.

[1] FDIC Community Banking Study (December 2012), Chapter 4, “Comparative Financial Performance: Community versus Non-community Banks.”

[2] The FDIC Community Banking Study focused on pretax ROA as opposed to ROA after tax, which was the basis of my conclusions in my first blog article. They stated that such a focus better facilitated comparisons between banks organized as C corporations (i.e., entities taxed at the bank level) and S corporations that are not taxed at the bank level. Without opining as to which measurement is better for the purposes of bank analysis, I will note that using pretax ROA instead of plain ROA for the purposes of my analysis would not have yielded much different relative comparisons among the different UBPR Peer Groups except for the fact that the largest peer group (banks larger than $3 billion) compared much more favorably, presumably because almost no S Corporations existed within that group. Notwithstanding their improved relative performance, Banks in that peer group still finished behind banks in peer group 7 (i.e., $100 million to $300 million, 2 or fewer branches, and with a non-metropolitan main office) with regards to average pretax ROA over the last 5 years (i.e., 0.97% vs. 0.87%).

[3] Paul Kupiec and Stefen Jacewitz, “Community Bank Efficiency and Economies of Scale,” FDIC, December 2012.

Low Rent and Ramen Noodles?

March 17, 2015 by Brunini Law

Like all of us, the older I get, the more I understand the genetics lessons I learned in high school biology. As a kid, I would sit at the dinner table every night and listen to my father tell his same favorite stories over and over again, laughing harder each time he told them. I have had similar experiences as an adult sitting around a board room table with him. However, now that I sit at the head of the dinner table every night, I catch myself laughing hysterically at my favorite stories about childhood, or college, or the first year of marriage, or my kids first few months, or any other period endearing to me, while my kids stare at me with a look that implies that the story is not really any more funny than the last time I told it.

One of my classic go to stories is about me and my wife’s family finances the first year of marriage. I was twenty-one when we married and had just graduated from Mississippi State with a Bachelor’s Degree in Accountancy two weeks before. I had plans to begin working on a Master’s of Professional Accountancy Degree at State the week after our wedding so I could achieve the hours I needed to sit for the CPA exam and ultimately join PricewaterhouseCoopers in Memphis, where I had accepted a job pending these requirements the semester before. My wife was about to start her senior year at Mississippi University for Women, and we cut our honeymoon in Jamaica a couple of days short (still the dumbest mistake I have ever made) so that we could hurry back before we missed too many days of summer school in pursuit of our ultimate educational goals.

That year and a half until we both ultimately graduated (at this point in the story my wife usually likes to remind me that I could not let this second graduation be enough and that she ultimately had to support me through three more years of law school before I decided to finally earn a living), we lived off of a small stipend I received as a graduate assistant at State, a humble paycheck my wife pulled in from a job on campus at the W, and I’m sure the occasional parental gift. My punchline to this story, which changes very little each time I tell it, is that “I promise we had more money then than we do now!”

The good thing about this story is that I often find a different audience to hear it each time so that it doesn’t get stale to anyone else except for my wife. Another good thing about it is that it always generates a laugh because whomever I tell it to often relates to it very well. As a matter of fact, I told it to a banking friend last week who agreed wholeheartedly that financial times seem much easier earlier in marriage than they do in mid-life. Why is that? It certainly is not because of income levels because my wife and I would have been lucky to earn $20,000 that first year. I never actually state the reason for this paradox, but I never have to because everyone knows why it is true. We were financially more secure early in married life because of the bottom part of our family income statement and not the top. As long as we scraped up enough cash to pay rent, the electric bill, and the occasional grocery bill, we could blow the rest however we chose. Things such as house maintenance, car payments (we still drove cars paid off by our parents as high school graduation gifts), tuition, retirement savings, kids’ clothes, baseball registration fees, etc., were too far in the distance to concern us.

Community banks are striving incredibly hard these days to increase the top line of their income statement, especially considering the way margins have compressed since the Great Recession. However, what if the same dynamic we all experienced as young married couples or young people in general also applied to community banks? What if the ultimate differentiator between higher earning community banks and lower earning community banks over the last five years was most related to their ability to control expenses instead of their ability to generate revenue?

We discussed in the previous articles how the Uniform Bank Performance Report (“UBPR”) data since 2010 indicates that smaller community banks have not necessary performed that much worse than their larger peers with regards to earnings, and as a matter of fact in many cases they performed better. We have also illustrated that the largest differentiator in bank earnings over that period of time seemed to be the location of the bank (i.e., urban v. rural) instead of the size of the bank, and that urban banks appeared to be at a disadvantage to rural banks when you consider their average ROE and ROA over the last five years. In the last article, we identified problem assets and loan provisions as part of the reason for that dynamic; however, a deeper look into the UBPR data indicates that operating expenses were much more responsible for the drag on urban banks than anything else.

When you look at the average Overhead Burden for banks over the last five years (i.e., non-interest expense less non-interest income), metro banks carried 49 basis points more of overhead as a percentage of total assets than non-metro banks. This means that, all other things being equal over the last five years, metro banks would have had to generate 49 basis points more of yield on their total assets through net interest income or securities gains in order to average the same ROA non-metro banks earned considering their lower overhead burden. As we have already discussed before, though, that did not happen.

Chart 7: Average Metro “Overhead Burden” vs. Non-Metro “Overhead Burden”


Chart-7
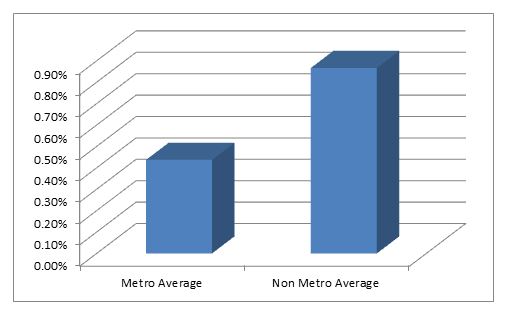
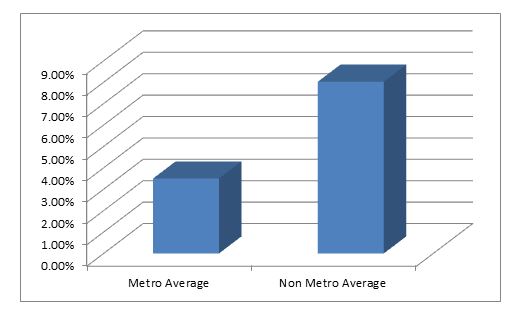
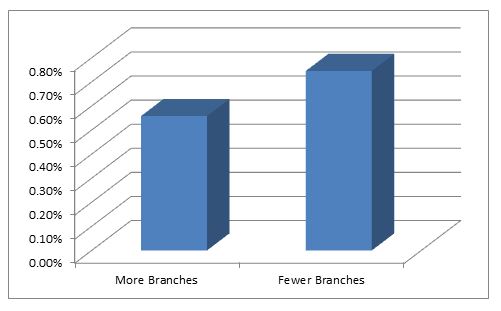
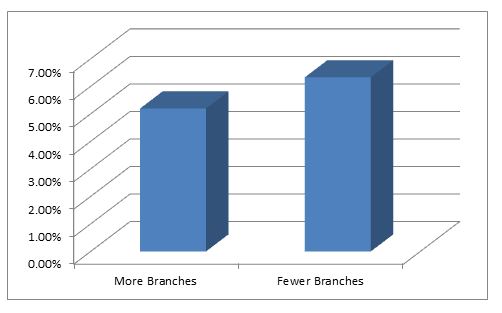
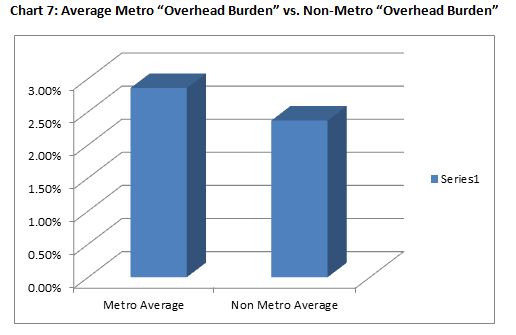
So why do metro banks spend more? Well, part of the reason may be tied to their large number of branch facilities which may be necessary to maintain market share in a larger market. According to that same data, banks in peer group categories with “more branches” had an average overhead burden to total assets of 2.79%, while banks in peer groups with fewer branches averaged a burden of 2.43%. Obviously, this would increase the costs related to occupancy and equipment, explaining why metro banks occupancy costs were higher than non-metro banks occupancy costs over that period (i.e., 0.44% average to total assets compared with 0.34% average to total assets) and banks with “more branches” carried higher occupancy costs as well (i.e., 0.45% compared to 0.33% for banks with “fewer branches”). Metro banks also averaged much higher “other expenses” (i.e., non-interest expenses excluding personnel and occupancy and equipment) than their non-metro counterparts (i.e., 1.28% on average to total assets relative to 0.97% for non-metro banks), and continuing with the theme that numbers of branches were the driver, banks with “more branches” averaged other expenses of 1.18% to total assets compared to an average of 1.07% for banks with “fewer branches.”

Possibly the most interesting differentiator appeared to be personnel expenses.   Metro Banks and banks with “more branches” both averaged 1.77% of personnel expenses to total assets over the last five years compared to non-metro banks and banks with fewer branches that both averaged 1.57%. However, contrary to the logical progression from the previous paragraph, this did not appear to be caused by the fact that metro banks had “more branches” and therefore more employees to staff additional offices. As a matter of fact, metro banks actually averaged slightly less assets per employee over the last five years (i.e., $3,910,000) than non-metro banks ($3,990,000), even though banks with “more branches” averaged much less assets per employee (I,e,$3,390,000) than banks with “fewer branches” (i.e., $4,510,000). Therefore, relative to assets, there was not much difference between the number of employees for metro banks and the number for rural banks, even though there was a big difference between banks with “more branches” relative to banks with “fewer branches”.

Then why are metro banks carrying so much more personnel expenses as a percentage of total assets than their rural counterparts? They are paying each person they employ more. On average over the last five years, metro banks paid each employee $64,850 while their non-metro counterparts paid $58,160 per employee. While that doesn’t sound like a big difference on its face, you multiply that $6,690 times fifty employees and you start to get to some real numbers.

Why are metro banks so generous? Well, if I had to guess, they are not paying it out of the goodness of their heart. Logic tells us that costs of living in metropolitan areas are higher, and that employees of banks in that area would demand a higher pay check to pay the bills, so maybe metro banks have to pay those larger paychecks just to compete for necessary staff in those areas. It is hard to prove this just by looking at UBPR data, so any such conclusion is just a guess. I know one thing, though. That first year of marriage sure would have been a lot harder in New York City than it was in Starkville, Mississippi.

“This Business Ain’t Hard, Son, You Just Can’t Make Bad Loans”

March 5, 2015 by Brunini Law

In April, 2008, I personally needed a change of scenery. I was extremely lucky to be part of arguably the largest banking law practice in the state at that time, and I was equally fortunate to have arguably the state’s best known banking attorney as my mentor. However, the pressures and stresses of balancing the practice of law, billable hours, and my family, which was four months into our second child, was beginning to wear on me. As a result, I made a decision, maybe somewhat hastily, to leave the practice of law and join the bank back home that my family had been involved in for some time. At that point in my life, “Bankers’ Hours” was a dream that was hard to forget and impossible to pass up.

Shortly after I left the firm and joined the bank, an older banker whom I had worked with and have a tremendous amount of respect for called me to chastise me for not telling him that I was leaving the firm. This banker had been around the business for a long time and had seen a lot. He had the charisma of a Marlon Brando with the down home common sense of an Andy Griffith, even though it is safe to say he did not have the Hollywood looks of either. After properly reprimanding me, he turned the conversation to wishing me luck and giving me whatever nuggets of wisdom I could use in my newfound career. He ended the conversation with this statement that has stuck with me since that day: “This business ain’t hard, son, you just can’t make bad loans.” Ironically, five months later, all hell broke loose in banking and within our nation’s economy, and his words remained in the background of my psyche like a continuing subtitle that I used to interpret the chaos that was ensuing all around the banking industry.

In December of 2012, the Federal Deposit Insurance Corporation (“FDIC”) conducted its “Community Banking Study,” which was “a data-driven effort to identify and explore issues and questions about community banks.” It analyzed banking data over the period of time between 1984 and 2011 and tried to analyze trends and circumstances that were altering the banking landscape for community banks and which impacted the performance of community banks as they entered the “Great Recession.” Chapter 5 of that study was a comparative performance of community bank lending specialty groups, and it focused mostly on how community banks had shifted their lending strategies prior to the recession and what affect that strategic change had on their performance during the recession. I found the following points to be particularly interesting:

  • In 1984, retail loans represented over 61 percent of all loans at “community banks[1]”, compared with 35 percent of all loans at “noncommunity banks.” By the end of 2011, these ratios had basically flipped so that retail loans made up 36 percent of community bank loans and 54 percent of noncommunity bank loans;
  • Between 1984 and 2011, residential real estate loans fell from 47 percent of community bank total loans to 32 percent, while commercial real estate loans rose from 21 percent of loans to 42 percent;
  • Commercial Real Estate (“CRE”) specialists[2] experienced the most volatile earnings performance during the examined period, and their pretax ROA trailed the community bank average by more than one-third;
  • CRE specialists had a high frequency of failure during the period examined, failing at a rate that was more than two time as frequent as similarly situated community banks;
  • Between 1991 and 2007, the number of CRE specialists increased fivefold, going from less than 4 percent of all community banks in 1991 to almost 30 percent of community banks at their peak in 2007;
  • For the entire study period, community banks with Commercial and Development (“C&D”) loans, a subset of CRE loans, greater than 10 percent of their assets were 2.8 times more likely to fail than the average community bank, while those with C&D loans below 10 percent were less likely to fail than the average community bank;
  • CRE specialists were the worst performers over the entire study period, performing slightly better than the average for all community banks in good economic times, but performing significantly worse during periods of banking crises; and
  • CRE specialists were primarily headquartered in metro counties (80 percent), and 74 percent of community banks with at least 10 percent of assets in C&D loans were primarily located in metro areas.

When I was examining the UBPR data for the period of time that mostly followed the FDIC’s study period, my first hypothesis for explaining the earnings discrepancy between metropolitan and non-metropolitan banks was that it had to be related to these “bad” CRE and C&D loans cited in this study that the wise banker warned me about. It seemed quite logical to me that metropolitan banks would have much lower earnings, even during this “recovery” period, because they were still fighting loan provisions and non-accrual loans from CRE and C&D loans that were just more prevalent in their markets.

After testing this assumption, it did appear to hold up, at least partially. From the beginning of 2010 through the end of 2014, banks under $300 million in assets and in a metro area averaged loan provisions that were 0.28% of total assets compared to loan provisions that averaged 0.17% of total assets for similarly sized banks headquartered in non-metro areas. Likewise, the same metro banks had average non-accruals equal to 1.72% of total loans during that period, while their rural counterparts had a non-accrual percentage of 1.04%. There is no doubt that higher balances of “bad” loans are still holding metropolitan banks back. By the way, for what it is worth, banks larger than $300 million averaged provisions and nonaccruals that were higher than each of these averages, even though their average earnings were on par with the smaller, rural banks and much higher than the smaller, metropolitan banks.

However, when I considered that rural banks under $300 million in assets had earnings that basically doubled those of similarly sized metro banks from 2010 through 2014, this answer alone did not seem to be sufficient to answer the question entirely, and it wasn’t. The rest of the story became evident when I dug deeper in the bottom half of the income statement, and that will be the topic of my next article.

[1] The study developed a new research definition of a community bank that was partially tied to asset size (i.e., an indexed maximum asset value that began at $250 million in 1984 and increased to $1 billion in 2010), but also considered “criteria related to traditional lending and deposit gathering activi­ties and limited geographic scope.”

[2] In order to be considered a “specialists” for the purposes of this study, a bank had to hold loans of that type greater than 33 percent of total assets.

Small Community Banks in Rural Areas Still Make Money?

February 27, 2015 by Brunini Law

“Wait a minute,” you say, “this can’t be right. Everything I have heard in banking for the past 20 years has told me my bank must get larger. We must abandon these old, rural markets for the greener pastures of America’s cities and suburbs, where loans and deposits flow like milk and honey.” Well, sit down, because the revelations discussed in my last post become even more dramatic. As mentioned in my earlier post, the UBPR divides the 12 Peer Groups covering banks under $300 million not only based upon size, but also based upon their “metropolitan” or “non-metropolitan” locations and their number of branches. By examining these 12 peer groups, I discovered that ”metropolitan bank” peer groups had average ROAs over the last 5 years (i.e., 0.44%) that collectively averaged approximately half those of “rural” peer groups (i.e., 0.87%), while having collective average ROEs (i.e., 3.50%) that were less than half of those recorded by their more rural cousins (i.e., 8.02%). Not only are rural banks more profitable than their metropolitan competitors, they have been running circles around them for the last five years. How do those same rural peer group averages compare to the averages for the “larger” peer groups 1, 2, and 3? Very favorably, thank you. The collective average ROE (i.e., 8.02%) for these rural peer groups (i.e., 5, 7, 9, 11, 13, and 15) was higher than the average ROE for each of the three larger peer groups (7.79%, 7.60%, and 7.59%, respectively), and the collective average ROA (i.e., 0.87%) for these rural peer groups was higher than all but one of the average ROAs of the three larger peer groups (0.88%, 0.79% and 0.80%, respectively). Therefore, maybe it’s not size that is the ultimate differentiator, but instead location. Contrary to everything I have believed and heard to this point, maybe it is a bank’s rural location that is its ace in the hole!

Chart 3: Average “Metropolitan” ROA vs. “Non-Metropolitan” ROA, 2010 – 2014

Chart-3


Chart 4: Average “Metropolitan” ROE vs. “Non-Metropolitan” ROE, 2010 – 2014

Chart-4


What is the one rumor that appears to be true? Well, that may be that brick and mortar are the albatross that everyone believes them now to be. Banks in the last 12 peer groups that have “more” branches (i.e., 4, 5, 8, 9, 12, and 13) had a collectively lower average ROA (i.e., 0.56% to 0.75%) than the peer groups with “fewer” branches, and their collective average ROE was lower as well (i.e., 5.20% compared to 6.33% for peer groups with ”fewer” branches).

Chart 5: Average “More Branches” ROA vs. “Fewer Branches” ROA, 2010 – 2014

Chart-5


Chart 6: Average “More Branches” ROE vs. “Fewer Branches” ROE, 2010 – 2014

Chart-6


Maybe I’m the only one surprised by these revelations. After all, the “User’s Guide for the Uniform Bank Performance Report – Technical Information” notices the following:

Consistent differences in peer group performance are apparent over time. For example, the average non-branch bank in a non-metropolitan area tends to have lower overhead, lower noninterest income, higher profitability and higher capital ratios than similar sized branch banks located in metropolitan areas.

Something tells me that not many people pick this up for bed time reading, though, so its truths may not be widely known. “Still,” you say, “how could it be that smaller, more rural banks turn a higher profit than larger, more metropolitan ones? That can’t be true since my bank is dedicating most of its resources to the nearby metropolitan area where all of its loan growth has occurred over the last five years.” I will elaborate further on what the UBPR data reveals as reasons for this irony in my next post, but to give you a hint, it is clearly related to the first metric listed in the “User’s Guide” quote above ( i.e., lower overhead). You may be generating a lot more loans and deposits from that metropolitan area and growing quickly as a result, but it also costs you a lot more money to do so. Maybe your father knew what he was telling you when he preached that a penny saved is always a penny earned.

Community Banks to America: “The Reports of My Death Were Greatly Exaggerated.”

February 19, 2015 by Brunini Law

We all know the story and ultimate conclusion, right? Commercial banking is becoming more complex, regulations are multiplying exponentially each passing day, commercial activity and related loans are migrating more and more to metropolitan areas, so therefore small town, community banks are quickly becoming a thing of the past. They simply can’t keep up. Not only are they losing loans to banks in faster growing, more populated areas, but they also are struggling to hire sufficient staff to comply with regulation, much less chase loans. They just don’t have the economies of scale or markets to support the inevitable overhead explosion and attract the top talent to their slow growing, rural economies. Sadly, their days are numbered. Within a decade or two, rural community banks with assets less than $1 billion will go the way of the dinosaur, victims of that terrible meteor named Dodd-Frank.

This must be the truth, right? Everything we learned in macroeconomics demands it. Bigger banks have more economies of scale to support the rising fixed costs associated with commercial banking, and smaller banks will eventually tap out. Metropolitan banks have more access to capital, loans, and growing deposit bases and therefore have an inherent advantage over their rural cousin the country bank. As a former CFO and COO of a rural, community bank, I know I bought it hook, line, and sinker. Looking at growing overhead, shrinking loans, and aging management, I was convinced this storyline was the only possible one. Heck, it’s a big reason why I decided a future in community banking was not for me, opting instead to return to the much more stable world of practicing law (note the presence of my tongue which is firmly implanted in my cheek).

The problem is, five years after the end of the great recession, the bank statistics published in the Uniform Bank Performance Reports (“UBPR”) by the Federal Financial Institutions Examination Council (“FFIEC”) simply don’t support this idea that small town community banks are dead, or that they are even dying. As a matter of fact, there is some argument to the contrary, at least in certain contexts.

In reaching this conclusion, I examined the UPBR average peer group data from the last five years for each of the 15 major peer groups for insured commercial banks. I excluded the peer groups related to De Novo banks created in the last five years which had the potential to skew the analysis due to the unique challenges faced by De Novo institutions. These 15 different peer groups, which included 5,619 banks, are delineated as follows:

Peer Group 1: Insured commercial banks in excess of $3 billion
Peer Group 2: Insured commercial banks between $1 billion and $3 billion
Peer Group 3: Insured commercial banks between $300 million and $1 billion
Peer Group 4: Insured commercial banks having assets between $100 million and $300 million, with 3  or more full service banking offices and located in a metropolitan statistical area
Peer Group 5: Insured commercial banks having assets between $100 million and $300 million, with 3 or more full service banking offices and not located in a metropolitan statistical area
Peer Group 6: Insured commercial banks having assets between $100 million and $300 million, with 2 or fewer full service banking offices and located in a metropolitan statistical area
Peer Group 7: Insured commercial banks having assets between $100 million and $300 million, with 2 or fewer full service banking offices and not located in a metropolitan statistical area
Peer Group 8: Insured commercial banks having assets between $50 million and $100 million, with 3 or more full service banking offices and located in a metropolitan statistical area
Peer Group 9: Insured commercial banks having assets between $50 million and $100 million, with 3 or more full service banking offices and not located in a metropolitan statistical area
Peer Group 10: Insured commercial banks having assets between $50 million and $100 million, with 2 or fewer full service banking offices and located in a metropolitan statistical area
Peer Group 11: Insured commercial banks having assets between $50 million and $100 million, with 2 or fewer full service banking offices and not located in a metropolitan statistical area
Peer Group 12: Insured commercial banks having assets less than $50 million, with 2 or more full service banking offices and located in a metropolitan statistical area
Peer Group 13: Insured commercial banks having assets less than $50 million, with 2 or more full service banking offices and not located in a metropolitan statistical area
Peer Group 14: Insured commercial banks having assets less than $50 million, with 1 full service banking office and located in a metropolitan statistical area
Peer Group 15: Insured commercial banks having assets less than $50 million, with 1 full service banking office and not located in a metropolitan statistical area

As of December 31, 2014, the average number of banks per peer group was 374.6 banks. The largest peer group by far was Peer Group 3 (i.e., banks between $300 million and $1 billion), which included 1,254 banks. The smallest peer group was Peer Group 12 (i.e., banks less than $50 million located in a metropolitan area and having 2 or more full branches), which contained 63 banks. The median peer group was Peer Group 2 (i.e., banks between $1 billion and $3 billion) with 321 banks.

This UBPR data separates banks into peer groups that distinguish them not only on the basis of size, but also based upon the number of full service branches operated by a bank as well as whether the bank is located in a metropolitan or non-metropolitan area. For the purposes of clarification, it is important to note that a bank may be classified as a non-metropolitan bank and still have full service branches in a metropolitan area, and vice versa. For example, a $150 million commercial bank whose main office is in a non-metropolitan area but who also operates another full service branch in a metropolitan area is part of Peer Group 7, which includes banks between $100 million and $300 million of assets that have 2 or fewer branches and are not located in a metropolitan area. Therefore, it is the main office location of the bank that controls and not the location of its branches. For the purposes of the UBPR, a metropolitan area is one classified as a Metropolitan Statistical Area by the Office of Management and Budget.

I first stumbled upon the truths presented by the UBPR while I was analyzing the performance data of a client. With the same prejudices in mind that I stated in the opening two paragraphs, I decided to compare that bank’s data to statistics for banks in “larger” peer groups. What I discovered astonished me and interested me to the point that I decided to dig deeper. Not only did the bank’s statistics compare more favorable to the data of “larger” peer groups than it did to statistics of its own peer group, but the average numbers for the bank’s peer group 7, which is assigned to relatively smaller, rural banks, seemed to soar well above some of its larger, more metropolitan cousins.

Peer group 7, which, as mentioned above, is reserved for banks between $100 million and $300 million in assets that are located in a non-metropolitan area and have 2 or fewer branches, averaged the highest Return on Equity (“ROE”) (i.e., 10.47%) and Return on Assets (“ROA”) (i.e., 1.16%) of any peer group over the last five years. What about the next highest ROE and ROA? Well those belonged to “rural, community” banks as well. Peer Group 11 (i.e., $50 million to $100 million, 2 or fewer branches, and non-metropolitan area) boasted the next highest ROA of 0.99%, and Peer Group 5 (i.e., $100 million to $300 million, 3 or more branches, and non-metropolitan area) claimed second place in ROE with 9.12%. Third place in each category also belonged to Peer Groups 11 and 5, just in reverse with respect to the category. Peer Group 1, the peer group for the nation’s largest banks (i.e., more than $3 billion in assets), doesn’t show up on either list until you look down to fourth place, where it finished with an average ROE of 7.79% and an average ROA of 0.88% over the last five years. In my next post, we will start to examine what could be the explanation of this and what secrets it could reveal to you regarding operating a community bank in this challenging environment.

Chart-1

Chart-2


sidebar

News

  • News
  • Coronavirus Updates
  • Blog
  • Recent Experience
  • Rankings & Awards
  • Newsletters
    • Banking
    • Brunini Update
    • Environmental Law
    • Labor and Employment
    • Health Care
  • Newsletter Signup
  • Jackson
©2023 Brunini. All rights reserved. Web Site by Fishman Marketing.
  • Firm Access
  • Disclaimer
  •