Samuel C. Kelly has been elected as a Fellow of the Mississippi Bar Foundation. He was inducted into membership at the Foundation’s recent Annual Meeting and Fellows Induction Ceremony held at the Old Capitol Inn in Jackson in April. A Fellow of the Mississippi Bar Foundation is a great honor bestowed on only a few each year. Selection as a Fellow is based not only on excellence as an attorney, but also on an attorney’s commitment to serve the Bar and the public. The Bar Foundation was organized in 1963 to improve the administration of justice. It presently administers the Interest On Lawyers Trust Accounts Program, which has awarded over eleven million dollars to public interest, law-related programs.
Community Banking: The Ultimate Moneyball
When I think about my childhood, the first and most vivid memory I have is of the summer before I turned 12. Although I didn’t realize it at the time, that summer was as close as I would ever come to realizing my dream of becoming a major league baseball player. That is because it was truly my only occupation, or obsession, for those three months. Each day, I would walk out of the house around 8:00 AM heading toward my friend Bill’s back yard, where I would play baseball with a “rag” ball (thank goodness considering how many houses and windows we hit) and my friends Chip, Clint, Jeff, Michael, and whomever else wandered up that day until the sun set and we were forced to go home. My specific job in the league, besides playing, was to serve as its official scorekeeper and statistician, which allowed me to combine my first love, baseball, with my second, numbers, in a way that still makes baseball appealing to me today. As each batter would come to the plate, I was duty bound to announce their season batting average as well as other pertinent statistics, such as how many homeruns they had hit off of the roof of the house next door. This love of baseball and numbers is still the reason I have to stay up until midnight watching “Moneyball” anytime I find it on cable at 10:30 P.M. It is also a trait I have passed along to my progeny, who keep the floors of our home covered with hundreds of baseball cards that they have sorted, studied, and stacked for hours like they had a final on Manny Machado’s slugging percentage the next day. Yes, my wife is an exceptional woman.
Because I love numbers, I subscribe to the philosophy that they don’t lie. However, I’m sure we are all familiar with Twain’s adopted view of statisticians, placing them on par with liars and the damned. Considering my love of numbers and my chosen profession, I’m not exactly comfortable about what such theories may imply about my character and my eternal prospects, Nevertheless, it would not surprise Twain to find out that the Federal Deposit Insurance Corporation (“FDIC”), after conducting an extensive study regarding issues facing community banks, reached a conclusion about the profitability of community banks relative to non-community banks that is contrary to many of the conclusions I have reached in recent blog articles.
To defend myself, before I discuss the FDIC’s conclusions, I think it is important to note a couple of important distinctions between the FDIC’s study and the research I have relied upon. First of all, that study adopts a completely different definition of community banks than the one I have relied upon. For the purposes of its study, the FDIC developed a new research definition of a community bank that was partially tied to asset size (i.e., an indexed maximum asset value that began at $250 million in 1984 and increased to $1 billion in 2010), but also considered “criteria related to traditional lending and deposit gathering activities and limited geographic scope” (e.g., loans to assets > 33%, core deposits to assets > 50%, numbers of offices, and numbers of offices in MSAs and other states). My definition of a community bank for these articles, particularly my first addressing their competitive profitability, has been much more fluid and has been based solely on asset size.
Secondly, the FDIC’s study period of community bank profitability (i.e., 1985 – 2011), in addition to being primarily before the time period I considered (i.e., 2010 – 2014), was also more than five times longer. Therefore, it encapsulated many more market cycles than the data I studied. For that reason, some may argue that it is more reliable because it is more comprehensive; however, I think the counterargument would be that the last five years have been the most relevant for community banks to consider in this new world since they reflect life in the post-apocalyptic world following Dodd-Frank and the Great Recession.
Nevertheless, considering these differences, I thought it was important to address the following conclusions reached by Chapter 4[1] of the FDIC study, some of which were contrary to my analysis:
- A comparison of pretax ROA[2] reveals that non-community banks (i.e., 1.31 % average pretax ROA) outperformed community banks (i.e., 1.02% average pretax ROA) during most of the FDIC study period;
- Non-community banks had greater success in generating noninterest income from a variety of sources (i.e., average of 2.05 % of average assets vs. 0.8 % for community banks over that same period), explaining much of the gap in earnings;
- Community banks, because of their heavy dependence on lending as a source of income and the long term trend toward lower net interest margins, also experienced a significant erosion in its traditional net interest income advantage over the last few years, which also contributed to the gap in pretax ROA; and
- Even though community banks have traditionally been less efficient than non-community banks, this gap, as measured by the efficiency ratio, widened over the FDIC study period. While the gap was only 3.5% between 1985 and 1998, it ballooned to 9.2 % between 1999 and 2011. This was driven by community bank’s decreasing competitiveness in generating revenue along with their decreasing advantage from lower noninterest expenses, which is now almost non-existent despite a long-term noninterest expense advantage of 22 basis points.
That being said, there were also several points made in Chapter 4 of the Community Banking Study that supported conclusions I reached in my analysis. For example, for both community banks and non-community banks, banks headquartered in metropolitan areas had lower pretax ROAs than banks headquartered in nonmetropolitan areas. Community banks headquartered in nonmetropolitan areas averaged a pretax ROA of 1.25% compared with 0.94% for their urban counterparts, while non-community banks headquartered in rural areas averaged a very impressive pretax ROA of 1.88% compared to 1.30% for community banks headquartered in metropolitan areas. Therefore, the “city bank -country bank” dichotomy identified in my previous articles held up in the FDIC study as well. The FDIC study also noted that community banks have almost always incurred lower credit losses than non-community banks, which helped to narrow the overall earnings gap during the latter years of the study. Finally, with both sets of data, there is little argument that larger banks experienced a significant advantage with regards to net overhead and efficiency ratios.
Nonetheless, even the FDIC has concluded that that “while the results show that community banks may benefit from economies of scale, there is no indication of any significant benefit beyond $500 million in asset size, and much of the benefits from scale appear to be achieved for [community banks] as small as $100 million.” [3] Instead, the study reaching this conclusion found that community bank’s decreasing competitiveness with regards to efficiency ratios is more closely related to the growing erosion of their net interest income advantage and their inability to increase their assets managed relative to numbers of employees the same way that non-community banks have. So, once again, maybe size isn’t all that important, at least when you are talking about bank assets. However, the limited size of my buddy Bill’s yard was extremely important since it allowed me to entertain a dream of hitting similar grand slams in major league parks one day, at least for a summer.
[1] FDIC Community Banking Study (December 2012), Chapter 4, “Comparative Financial Performance: Community versus Non-community Banks.”
[2] The FDIC Community Banking Study focused on pretax ROA as opposed to ROA after tax, which was the basis of my conclusions in my first blog article. They stated that such a focus better facilitated comparisons between banks organized as C corporations (i.e., entities taxed at the bank level) and S corporations that are not taxed at the bank level. Without opining as to which measurement is better for the purposes of bank analysis, I will note that using pretax ROA instead of plain ROA for the purposes of my analysis would not have yielded much different relative comparisons among the different UBPR Peer Groups except for the fact that the largest peer group (banks larger than $3 billion) compared much more favorably, presumably because almost no S Corporations existed within that group. Notwithstanding their improved relative performance, Banks in that peer group still finished behind banks in peer group 7 (i.e., $100 million to $300 million, 2 or fewer branches, and with a non-metropolitan main office) with regards to average pretax ROA over the last 5 years (i.e., 0.97% vs. 0.87%).
[3] Paul Kupiec and Stefen Jacewitz, “Community Bank Efficiency and Economies of Scale,” FDIC, December 2012.
Kaufman and Cirilli Victorious in Mississippi Supreme Court Appeal of Chancery Court Ruling Regarding Cost for Lamar County to Withdraw from the Pat Harrison Waterway District
David Kaufman and Richard Cirilli represented Lamar County, Mississippi; the Lamar County Board of Supervisors and its president, Joe Bounds; and the Tax Collector for Lamar County in an action filed in the Chancery Court of Forrest County, Mississippi, by the Pat Harrison Waterway District. The issue involved in the lawsuit was the amount that Lamar County was required to pay the Pat Harrison Waterway District, pursuant to Section 51-15-118 of the Mississippi Code, following the County’s withdrawal from the District on September 6, 2011. An independent auditor retained by the parties pursuant to the statute determined that Lamar County owed $337,088. The auditor rejected the District’s position that Lamar County was responsible for the District’s alleged perpetual operating costs under its federal government contracts which the District claimed totaled approximately $18,000,000. The Chancery Court Judge agreed with the independent auditor and ruled in favor of Lamar County, and the District subsequently appealed to the Mississippi Supreme Court. On March 19, 2015, the Mississippi Supreme Court issued its opinion and affirmed the Chancery Court’s decision. The Supreme Court determined that the alleged perpetual operating costs of the District were not “contractual obligations” that were “outstanding” on the date of Lamar County’s withdrawal, and therefore, Lamar County was not obligated for these costs pursuant to Section 51-15-118.
Related Attorneys
Mississippi Environmental Quality Permit Board Summary of Meeting Held March 17, 2015
Prepared By Brunini, Grantham, Grower & Hewes, PLLC
The Environmental Practice Group of the Brunini Law Firm publishes a summary of the proceedings of each monthly meeting of the Mississippi Environmental Quality Permit Board and of the Mississippi Commission on Environmental Quality. We strive to provide, in a succinct newsletter format, the key points addressed in each meeting that will be of interest to the regulated community in Mississippi.
If you have any questions concerning the content of a newsletter it would like further information about the matters addressed in a newsletter, please contact John Milner, the Brunini Firm Environmental Practice Group leader, at jmilner@brunini.com or (601) 960-6842.
Meeting Summary
The Mississippi Environmental Quality Permit Board (Board) convened its regular monthly meeting at 9:00 a.m. on March 17, 2015 at the offices of the Mississippi Department of Environmental Quality in Jackson. Ms. Leslie Royals, PE chaired the meeting. The Board approved minutes from the February meeting and all non-controversial actions/certifications by the staff since the February meeting. Following a prepared agenda, items considered were as follows:
OFFICE OF GEOLOGY
In accordance with staff’s recommendations, the Board approved the following surface mining bond releases and permits to approve.
Surface Mining Bond Releases:
|
Permittee |
County |
Permit |
Staff Recommendation |
| Eutaw Construction Company, Inc. |
Rankin |
P12-020 |
30% Release |
| W.G. Yates & Sons Construction Co. |
DeSoto |
P13-009T |
60% Release |
The following Surface Mining Permit Transfer was withdrawn pending additional information to be submitted by applicant.
|
Permittee |
County |
Permit |
| Joe McGee Construction Company, Inc., to Green Earth Materials, LLC |
Rankin |
P06-10T1A |
OFFICE OF POLLUTION CONTROL
Solid Waste Management & Mining Branch
Staff recommended approval of permits for the Northeast MS Regional Landfill in Tippah County. After noting that the applicant is in compliance with all permits, the Board approved the following renewals: Modification of Wastewater Pretreatment Permit (MSP091079), Title V (2660-00055), Stormwater NPDES (MSS049301).
Construction and Building Material Branch
Michael Griffin of MDEQ staff stated that the Board has approved the State Wide Multimedia Hot Mix Asphalt Facility General Permit (MSR70).
Staff also reported that minor modifications to the MMS Materials, Inc. facility in Scott County are complete. The facility is currently in compliance with all permits. The Board approved the facility’s Ready Mix General Permit (MSG110026).
MDEQ staff stated that Dry Asset purchased the Picayune Frac Plant facility formerly owned by Alliance Consulting Group, LLC (Alliance). Dry Asset purchased the facility, located in Pearl River County in bankruptcy proceedings. Following discussion, the Board approved the proposed name change for the following permits: Water Quality Certification (WQC2012071), Air Construction (2180-00052), Baseline Stormwater (MSR002071), and Construction (MSR106120). Staff also reminded the Board of the upcoming Evidentiary Hearing that had been postponed because of the bankruptcy (no date specified).
In discussion, MDEQ staff stated that Shale Support Services (Operator) will continue to operate with facility no change in activities. MDEQ previously cited Alliance for operating prior to issuance of a permit in 2012 and cited Operator in 2013. However, all penalties have been paid and multiple site visits performed by MDEQ indicated no odor or sedimentation issues.
Mr. Skip Negratto of Gulfport, attorney for residents of Ravenwood subdivision, stated that residents have filed numerous complaints regarding odor and sedimentation concerns at the facility. Mr. Negratto presented photos documenting odor/air quality concerns and turbid stormwater runoff. Mr. Negratto requested that the Board postpone approval of Dry Asset’s permits until after the Evidentiary Hearing.
Ms. Amanda Tollison, attorney for Alliance and Dry Asset, noted that the facility is in an industrial park that was established prior to development of Ravenwood subdivision. The Dry Asset facility dries sand and does not produce odors. Other industries within the park include plastics and chemical creosote operations, which may be the source of odor.
OTHER BUSINESS
The next Permit Board meeting will be held on April 14, 2015 at 9 a.m.
This Newsletter is a publication of the Environmental Department of the law firm of Brunini, Grantham, Grower & Hewes located in Jackson, Mississippi. This Newsletter is not designed or intended to provide legal or professional advice, as any such advice requires the consideration of the facts of the specific situation.
IRS Circular 230 Notice
To ensure compliance with requirements imposed by the IRS, we inform you that, unless specifically indicated otherwise, any tax advice contained in this communication (including any attachments) was not intended or written to be used, and cannot be used, for the purpose of (i) avoiding tax-related penalties under the Internal Revenue Code, or (ii) promoting, marketing, or recommending to another party any tax-related matter addressed herein.
Related Attorneys
Low Rent and Ramen Noodles?
Like all of us, the older I get, the more I understand the genetics lessons I learned in high school biology. As a kid, I would sit at the dinner table every night and listen to my father tell his same favorite stories over and over again, laughing harder each time he told them. I have had similar experiences as an adult sitting around a board room table with him. However, now that I sit at the head of the dinner table every night, I catch myself laughing hysterically at my favorite stories about childhood, or college, or the first year of marriage, or my kids first few months, or any other period endearing to me, while my kids stare at me with a look that implies that the story is not really any more funny than the last time I told it.
One of my classic go to stories is about me and my wife’s family finances the first year of marriage. I was twenty-one when we married and had just graduated from Mississippi State with a Bachelor’s Degree in Accountancy two weeks before. I had plans to begin working on a Master’s of Professional Accountancy Degree at State the week after our wedding so I could achieve the hours I needed to sit for the CPA exam and ultimately join PricewaterhouseCoopers in Memphis, where I had accepted a job pending these requirements the semester before. My wife was about to start her senior year at Mississippi University for Women, and we cut our honeymoon in Jamaica a couple of days short (still the dumbest mistake I have ever made) so that we could hurry back before we missed too many days of summer school in pursuit of our ultimate educational goals.
That year and a half until we both ultimately graduated (at this point in the story my wife usually likes to remind me that I could not let this second graduation be enough and that she ultimately had to support me through three more years of law school before I decided to finally earn a living), we lived off of a small stipend I received as a graduate assistant at State, a humble paycheck my wife pulled in from a job on campus at the W, and I’m sure the occasional parental gift. My punchline to this story, which changes very little each time I tell it, is that “I promise we had more money then than we do now!”
The good thing about this story is that I often find a different audience to hear it each time so that it doesn’t get stale to anyone else except for my wife. Another good thing about it is that it always generates a laugh because whomever I tell it to often relates to it very well. As a matter of fact, I told it to a banking friend last week who agreed wholeheartedly that financial times seem much easier earlier in marriage than they do in mid-life. Why is that? It certainly is not because of income levels because my wife and I would have been lucky to earn $20,000 that first year. I never actually state the reason for this paradox, but I never have to because everyone knows why it is true. We were financially more secure early in married life because of the bottom part of our family income statement and not the top. As long as we scraped up enough cash to pay rent, the electric bill, and the occasional grocery bill, we could blow the rest however we chose. Things such as house maintenance, car payments (we still drove cars paid off by our parents as high school graduation gifts), tuition, retirement savings, kids’ clothes, baseball registration fees, etc., were too far in the distance to concern us.
Community banks are striving incredibly hard these days to increase the top line of their income statement, especially considering the way margins have compressed since the Great Recession. However, what if the same dynamic we all experienced as young married couples or young people in general also applied to community banks? What if the ultimate differentiator between higher earning community banks and lower earning community banks over the last five years was most related to their ability to control expenses instead of their ability to generate revenue?
We discussed in the previous articles how the Uniform Bank Performance Report (“UBPR”) data since 2010 indicates that smaller community banks have not necessary performed that much worse than their larger peers with regards to earnings, and as a matter of fact in many cases they performed better. We have also illustrated that the largest differentiator in bank earnings over that period of time seemed to be the location of the bank (i.e., urban v. rural) instead of the size of the bank, and that urban banks appeared to be at a disadvantage to rural banks when you consider their average ROE and ROA over the last five years. In the last article, we identified problem assets and loan provisions as part of the reason for that dynamic; however, a deeper look into the UBPR data indicates that operating expenses were much more responsible for the drag on urban banks than anything else.
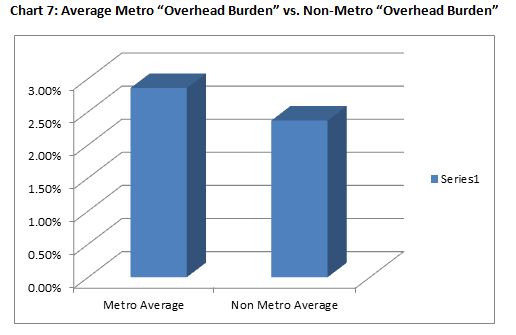
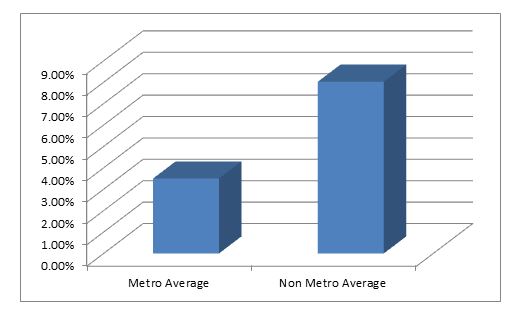
When you look at the average Overhead Burden for banks over the last five years (i.e., non-interest expense less non-interest income), metro banks carried 49 basis points more of overhead as a percentage of total assets than non-metro banks. This means that, all other things being equal over the last five years, metro banks would have had to generate 49 basis points more of yield on their total assets through net interest income or securities gains in order to average the same ROA non-metro banks earned considering their lower overhead burden. As we have already discussed before, though, that did not happen.
Chart 7: Average Metro “Overhead Burden” vs. Non-Metro “Overhead Burden”
 So why do metro banks spend more? Well, part of the reason may be tied to their large number of branch facilities which may be necessary to maintain market share in a larger market. According to that same data, banks in peer group categories with “more branches” had an average overhead burden to total assets of 2.79%, while banks in peer groups with fewer branches averaged a burden of 2.43%. Obviously, this would increase the costs related to occupancy and equipment, explaining why metro banks occupancy costs were higher than non-metro banks occupancy costs over that period (i.e., 0.44% average to total assets compared with 0.34% average to total assets) and banks with “more branches” carried higher occupancy costs as well (i.e., 0.45% compared to 0.33% for banks with “fewer branches”). Metro banks also averaged much higher “other expenses” (i.e., non-interest expenses excluding personnel and occupancy and equipment) than their non-metro counterparts (i.e., 1.28% on average to total assets relative to 0.97% for non-metro banks), and continuing with the theme that numbers of branches were the driver, banks with “more branches” averaged other expenses of 1.18% to total assets compared to an average of 1.07% for banks with “fewer branches.”
Possibly the most interesting differentiator appeared to be personnel expenses. Metro Banks and banks with “more branches” both averaged 1.77% of personnel expenses to total assets over the last five years compared to non-metro banks and banks with fewer branches that both averaged 1.57%. However, contrary to the logical progression from the previous paragraph, this did not appear to be caused by the fact that metro banks had “more branches” and therefore more employees to staff additional offices. As a matter of fact, metro banks actually averaged slightly less assets per employee over the last five years (i.e., $3,910,000) than non-metro banks ($3,990,000), even though banks with “more branches” averaged much less assets per employee (I,e,$3,390,000) than banks with “fewer branches” (i.e., $4,510,000). Therefore, relative to assets, there was not much difference between the number of employees for metro banks and the number for rural banks, even though there was a big difference between banks with “more branches” relative to banks with “fewer branches”.
Then why are metro banks carrying so much more personnel expenses as a percentage of total assets than their rural counterparts? They are paying each person they employ more. On average over the last five years, metro banks paid each employee $64,850 while their non-metro counterparts paid $58,160 per employee. While that doesn’t sound like a big difference on its face, you multiply that $6,690 times fifty employees and you start to get to some real numbers.
Why are metro banks so generous? Well, if I had to guess, they are not paying it out of the goodness of their heart. Logic tells us that costs of living in metropolitan areas are higher, and that employees of banks in that area would demand a higher pay check to pay the bills, so maybe metro banks have to pay those larger paychecks just to compete for necessary staff in those areas. It is hard to prove this just by looking at UBPR data, so any such conclusion is just a guess. I know one thing, though. That first year of marriage sure would have been a lot harder in New York City than it was in Starkville, Mississippi.
“This Business Ain’t Hard, Son, You Just Can’t Make Bad Loans”
In April, 2008, I personally needed a change of scenery. I was extremely lucky to be part of arguably the largest banking law practice in the state at that time, and I was equally fortunate to have arguably the state’s best known banking attorney as my mentor. However, the pressures and stresses of balancing the practice of law, billable hours, and my family, which was four months into our second child, was beginning to wear on me. As a result, I made a decision, maybe somewhat hastily, to leave the practice of law and join the bank back home that my family had been involved in for some time. At that point in my life, “Bankers’ Hours” was a dream that was hard to forget and impossible to pass up.
Shortly after I left the firm and joined the bank, an older banker whom I had worked with and have a tremendous amount of respect for called me to chastise me for not telling him that I was leaving the firm. This banker had been around the business for a long time and had seen a lot. He had the charisma of a Marlon Brando with the down home common sense of an Andy Griffith, even though it is safe to say he did not have the Hollywood looks of either. After properly reprimanding me, he turned the conversation to wishing me luck and giving me whatever nuggets of wisdom I could use in my newfound career. He ended the conversation with this statement that has stuck with me since that day: “This business ain’t hard, son, you just can’t make bad loans.” Ironically, five months later, all hell broke loose in banking and within our nation’s economy, and his words remained in the background of my psyche like a continuing subtitle that I used to interpret the chaos that was ensuing all around the banking industry.
In December of 2012, the Federal Deposit Insurance Corporation (“FDIC”) conducted its “Community Banking Study,” which was “a data-driven effort to identify and explore issues and questions about community banks.” It analyzed banking data over the period of time between 1984 and 2011 and tried to analyze trends and circumstances that were altering the banking landscape for community banks and which impacted the performance of community banks as they entered the “Great Recession.” Chapter 5 of that study was a comparative performance of community bank lending specialty groups, and it focused mostly on how community banks had shifted their lending strategies prior to the recession and what affect that strategic change had on their performance during the recession. I found the following points to be particularly interesting:
- In 1984, retail loans represented over 61 percent of all loans at “community banks[1]”, compared with 35 percent of all loans at “noncommunity banks.” By the end of 2011, these ratios had basically flipped so that retail loans made up 36 percent of community bank loans and 54 percent of noncommunity bank loans;
- Between 1984 and 2011, residential real estate loans fell from 47 percent of community bank total loans to 32 percent, while commercial real estate loans rose from 21 percent of loans to 42 percent;
- Commercial Real Estate (“CRE”) specialists[2] experienced the most volatile earnings performance during the examined period, and their pretax ROA trailed the community bank average by more than one-third;
- CRE specialists had a high frequency of failure during the period examined, failing at a rate that was more than two time as frequent as similarly situated community banks;
- Between 1991 and 2007, the number of CRE specialists increased fivefold, going from less than 4 percent of all community banks in 1991 to almost 30 percent of community banks at their peak in 2007;
- For the entire study period, community banks with Commercial and Development (“C&D”) loans, a subset of CRE loans, greater than 10 percent of their assets were 2.8 times more likely to fail than the average community bank, while those with C&D loans below 10 percent were less likely to fail than the average community bank;
- CRE specialists were the worst performers over the entire study period, performing slightly better than the average for all community banks in good economic times, but performing significantly worse during periods of banking crises; and
- CRE specialists were primarily headquartered in metro counties (80 percent), and 74 percent of community banks with at least 10 percent of assets in C&D loans were primarily located in metro areas.
When I was examining the UBPR data for the period of time that mostly followed the FDIC’s study period, my first hypothesis for explaining the earnings discrepancy between metropolitan and non-metropolitan banks was that it had to be related to these “bad” CRE and C&D loans cited in this study that the wise banker warned me about. It seemed quite logical to me that metropolitan banks would have much lower earnings, even during this “recovery” period, because they were still fighting loan provisions and non-accrual loans from CRE and C&D loans that were just more prevalent in their markets.
After testing this assumption, it did appear to hold up, at least partially. From the beginning of 2010 through the end of 2014, banks under $300 million in assets and in a metro area averaged loan provisions that were 0.28% of total assets compared to loan provisions that averaged 0.17% of total assets for similarly sized banks headquartered in non-metro areas. Likewise, the same metro banks had average non-accruals equal to 1.72% of total loans during that period, while their rural counterparts had a non-accrual percentage of 1.04%. There is no doubt that higher balances of “bad” loans are still holding metropolitan banks back. By the way, for what it is worth, banks larger than $300 million averaged provisions and nonaccruals that were higher than each of these averages, even though their average earnings were on par with the smaller, rural banks and much higher than the smaller, metropolitan banks.
However, when I considered that rural banks under $300 million in assets had earnings that basically doubled those of similarly sized metro banks from 2010 through 2014, this answer alone did not seem to be sufficient to answer the question entirely, and it wasn’t. The rest of the story became evident when I dug deeper in the bottom half of the income statement, and that will be the topic of my next article.
[1] The study developed a new research definition of a community bank that was partially tied to asset size (i.e., an indexed maximum asset value that began at $250 million in 1984 and increased to $1 billion in 2010), but also considered “criteria related to traditional lending and deposit gathering activities and limited geographic scope.”
[2] In order to be considered a “specialists” for the purposes of this study, a bank had to hold loans of that type greater than 33 percent of total assets.
Mississippi Commission on Environmental Quality Summary of Meeting Held February 26, 2015
Prepared By Brunini, Grantham, Grower & Hewes, PLLC
The Environmental Practice Group of the Brunini Law Firm publishes a summary of the proceedings of each monthly meeting of the Mississippi Environmental Quality Permit Board and of the Mississippi Commission on Environmental Quality. We strive to provide, in a succinct newsletter format, the key points addressed in each meeting that will be of interest to the regulated community in Mississippi.
If you have any questions concerning the content of a newsletter it would like further information about the matters addressed in a newsletter, please contact John Milner, the Brunini Firm Environmental Practice Group leader, at jmilner@brunini.com or (601) 960-6842.
Meeting Summary
The Mississippi Commission on Environmental Quality convened at 9:00 a.m. on February 26, 2015, at the offices of the Mississippi Department of Environmental Quality in Jackson. The Commission approved minutes from the previous meeting held on November 20, 2014.
Following a prepared agenda, items considered were as follows:
FY 2016 TITLE V FEE RECOMMENDATION
A Public Hearing concerning the FY2016 Title V Air Permit Fee was held on January 15, 2015. No comments were received. Copies of the public hearing transcript have been provided. The staff will recommend that the Commission set the FY2016 Title V fee at $41.00 per ton of regulated air pollutants with a minimum fee of $250.00.
PILOT TRAVEL CENTERS LLC—MOSS POINT, JACKSON COUNTY—PRESENTATION OF EVIDENTIARY HEARNING RECORD AND RECOMMENDATION OF HEARNING OFFICER
Pilot Travel Centers LLC requested a formal evidentiary hearing after MDEQ staff determined that Pilot was not eligible for reimbursement for assessment and remediation costs from the Mississippi Groundwater Protection Trust Fund for releases that occurred in March 2013 and thereafter, at Pilot’s Underground Storage Tank site located at 6705 Highway 63 in Moss Point. On May 22, 2104, the Commission designated Ricky Luke, Assistant Attorney General, as the hearing officer to conduct the hearing to prepare a record for the Commission’s consideration. Hearing officer Luke conducted the evidentiary hearing on Sept. 11, 2014. Mr. Luke presented his findings of fact and his recommended decision for the Commission’s consideration.
CERTIFICATIONS APPROVED
Asbestos: 319 certifications
Lead Paint: 78 certifications
Underground Storage Tanks: 5 certifications
EMERGENCY CLEAN-UP EXPENSES APPROVED
Six (6) emergency clean-up expenditures occurred since the last report.
ADMINISTRATIVE ORDERS APPROVED
Twenty-five (25) administrative orders were issued by the Executive Director and approved by the Commission since the last report. These include the following matters:
| Program Area | Number of Orders | Penalty Range |
| NPDES | 3 | $6,250 – $50,000 |
| Large Construction Stormwater | 3 | $5,000 – $23,000 |
| Asbestos Removal | 5 | $2,500 – $7,500 |
| Air | 3 | $19,000 – $37,500 |
| Hazardous Waste | 3 | $15,000 – $275,000 |
| Surface Water Withdrawal | 1 | $60,000 |
| Solid Waste | 1 | $4,000 |
An order confirms the adoption of the Commission Regulation 11 Mississippi Administrative Code, Part 2, Chapter 11 entitled “Regulations for Ambient Air Quality Nonattainment Areas” along with the associated Revision to the Mississippi State Implementation Plan for Control of Air Pollution (SIP Revision).
An order confirms the adoption of amendment to Commission Regulation 11 Mississippi Administrative Code, Part 1, Chapter 1 entitled “Air Emission Regulations for the Prevention, Abatement, and Control of Contaminants.”
The next Commission meeting is scheduled for March 26, 2015.
This Newsletter is a publication of the Environmental Department of the law firm of Brunini, Grantham, Grower & Hewes located in Jackson, Mississippi.
This Newsletter is not designed or intended to provide legal or professional advice, as any such advice requires the consideration of the facts of the specific situation.
IRS Circular 230 Notice
To ensure compliance with requirements imposed by the IRS, we inform you that, unless specifically indicated otherwise, any tax advice contained in this communication (including any attachments) was not intended or written to be used, and cannot be used, for the purpose of (i) avoiding tax-related penalties under the Internal Revenue Code, or (ii) promoting, marketing, or recommending to another party any tax-related matter addressed herein.
Related Attorneys
Small Community Banks in Rural Areas Still Make Money?
“Wait a minute,” you say, “this can’t be right. Everything I have heard in banking for the past 20 years has told me my bank must get larger. We must abandon these old, rural markets for the greener pastures of America’s cities and suburbs, where loans and deposits flow like milk and honey.” Well, sit down, because the revelations discussed in my last post become even more dramatic. As mentioned in my earlier post, the UBPR divides the 12 Peer Groups covering banks under $300 million not only based upon size, but also based upon their “metropolitan” or “non-metropolitan” locations and their number of branches. By examining these 12 peer groups, I discovered that ”metropolitan bank” peer groups had average ROAs over the last 5 years (i.e., 0.44%) that collectively averaged approximately half those of “rural” peer groups (i.e., 0.87%), while having collective average ROEs (i.e., 3.50%) that were less than half of those recorded by their more rural cousins (i.e., 8.02%). Not only are rural banks more profitable than their metropolitan competitors, they have been running circles around them for the last five years. How do those same rural peer group averages compare to the averages for the “larger” peer groups 1, 2, and 3? Very favorably, thank you. The collective average ROE (i.e., 8.02%) for these rural peer groups (i.e., 5, 7, 9, 11, 13, and 15) was higher than the average ROE for each of the three larger peer groups (7.79%, 7.60%, and 7.59%, respectively), and the collective average ROA (i.e., 0.87%) for these rural peer groups was higher than all but one of the average ROAs of the three larger peer groups (0.88%, 0.79% and 0.80%, respectively). Therefore, maybe it’s not size that is the ultimate differentiator, but instead location. Contrary to everything I have believed and heard to this point, maybe it is a bank’s rural location that is its ace in the hole!
Chart 3: Average “Metropolitan” ROA vs. “Non-Metropolitan” ROA, 2010 – 2014
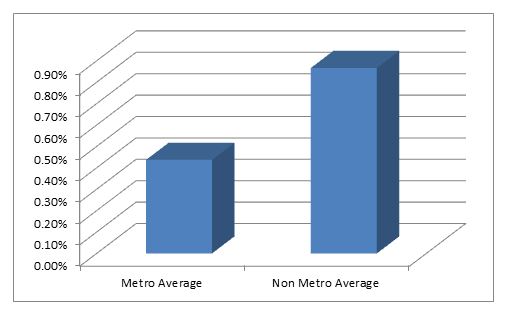
Chart 4: Average “Metropolitan” ROE vs. “Non-Metropolitan” ROE, 2010 – 2014
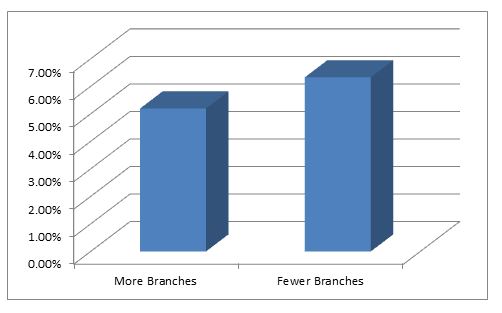
What is the one rumor that appears to be true? Well, that may be that brick and mortar are the albatross that everyone believes them now to be. Banks in the last 12 peer groups that have “more” branches (i.e., 4, 5, 8, 9, 12, and 13) had a collectively lower average ROA (i.e., 0.56% to 0.75%) than the peer groups with “fewer” branches, and their collective average ROE was lower as well (i.e., 5.20% compared to 6.33% for peer groups with ”fewer” branches).
Chart 5: Average “More Branches” ROA vs. “Fewer Branches” ROA, 2010 – 2014
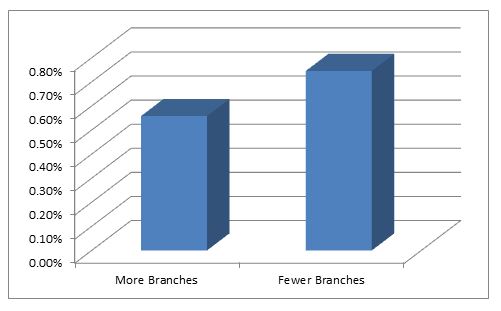
Chart 6: Average “More Branches” ROE vs. “Fewer Branches” ROE, 2010 – 2014
Maybe I’m the only one surprised by these revelations. After all, the “User’s Guide for the Uniform Bank Performance Report – Technical Information” notices the following:
Consistent differences in peer group performance are apparent over time. For example, the average non-branch bank in a non-metropolitan area tends to have lower overhead, lower noninterest income, higher profitability and higher capital ratios than similar sized branch banks located in metropolitan areas.
Something tells me that not many people pick this up for bed time reading, though, so its truths may not be widely known. “Still,” you say, “how could it be that smaller, more rural banks turn a higher profit than larger, more metropolitan ones? That can’t be true since my bank is dedicating most of its resources to the nearby metropolitan area where all of its loan growth has occurred over the last five years.” I will elaborate further on what the UBPR data reveals as reasons for this irony in my next post, but to give you a hint, it is clearly related to the first metric listed in the “User’s Guide” quote above ( i.e., lower overhead). You may be generating a lot more loans and deposits from that metropolitan area and growing quickly as a result, but it also costs you a lot more money to do so. Maybe your father knew what he was telling you when he preached that a penny saved is always a penny earned.
Mississippi Environmental Quality Permit Board Summary of Meeting Held February 10, 2015
Prepared By Brunini, Grantham, Grower & Hewes, PLLC
The Environmental Practice Group of the Brunini Law Firm publishes a summary of the proceedings of each monthly meeting of the Mississippi Environmental Quality Permit Board and of the Mississippi Commission on Environmental Quality. We strive to provide, in a succinct newsletter format, the key points addressed in each meeting that will be of interest to the regulated community in Mississippi.
If you have any questions concerning the content of a newsletter it would like further information about the matters addressed in a newsletter, please contact John Milner, the Brunini Firm Environmental Practice Group leader, at jmilner@brunini.com or (601) 960-6842.
Meeting Summary
The Mississippi Environmental Quality Permit Board (Board) convened its regular monthly meeting at 9:00 a.m. on February 10, 2015 at the offices of the Mississippi Department of Environmental Quality in Jackson. Mrs. Leslie Royals, PE chaired the meeting. The Board approved minutes from the January meeting and all non-controversial actions/certifications by the staff since the January meeting. Following a prepared agenda, items considered were as follows:
OFFICE OF GEOLOGY
In accordance with staff’s recommendations, the Board approved the following surface mining bond releases and permits to approve.
Surface Mining Bond Releases:
|
Permittee |
County |
Permit |
| Eutaw Construction Company, Inc. |
Pontotoc |
P11-021 |
| Eutaw Construction Company, Inc. |
Pontotoc |
P11-022 |
| Riverside Construction Company, Inc. |
Warren |
P10-030 |
| Walters Development, LLC |
Jones |
P07-030 |
Mr. James Matheny of MDEQ staff recommended approval of the following surface mining permit.
Surface Mining Permit Approvals:
|
Permittee |
County |
Permit |
Staff Recommendation |
| Rockco Mining LLC |
Panola |
P13-09A |
Approve |
OTHER BUSINESS:
The next Permit Board meeting will be held on March 17, 2015 at 9 a.m.
This Newsletter is a publication of the Environmental Department of the law firm of Brunini, Grantham, Grower & Hewes located in Jackson, Mississippi. This Newsletter is not designed or intended to provide legal or professional advice, as any such advice requires the consideration of the facts of the specific situation.
IRS Circular 230 Notice
To ensure compliance with requirements imposed by the IRS, we inform you that, unless specifically indicated otherwise, any tax advice contained in this communication (including any attachments) was not intended or written to be used, and cannot be used, for the purpose of (i) avoiding tax-related penalties under the Internal Revenue Code, or (ii) promoting, marketing, or recommending to another party any tax-related matter addressed herein.
Related Attorneys
Community Banks to America: “The Reports of My Death Were Greatly Exaggerated.”
We all know the story and ultimate conclusion, right? Commercial banking is becoming more complex, regulations are multiplying exponentially each passing day, commercial activity and related loans are migrating more and more to metropolitan areas, so therefore small town, community banks are quickly becoming a thing of the past. They simply can’t keep up. Not only are they losing loans to banks in faster growing, more populated areas, but they also are struggling to hire sufficient staff to comply with regulation, much less chase loans. They just don’t have the economies of scale or markets to support the inevitable overhead explosion and attract the top talent to their slow growing, rural economies. Sadly, their days are numbered. Within a decade or two, rural community banks with assets less than $1 billion will go the way of the dinosaur, victims of that terrible meteor named Dodd-Frank.
This must be the truth, right? Everything we learned in macroeconomics demands it. Bigger banks have more economies of scale to support the rising fixed costs associated with commercial banking, and smaller banks will eventually tap out. Metropolitan banks have more access to capital, loans, and growing deposit bases and therefore have an inherent advantage over their rural cousin the country bank. As a former CFO and COO of a rural, community bank, I know I bought it hook, line, and sinker. Looking at growing overhead, shrinking loans, and aging management, I was convinced this storyline was the only possible one. Heck, it’s a big reason why I decided a future in community banking was not for me, opting instead to return to the much more stable world of practicing law (note the presence of my tongue which is firmly implanted in my cheek).
The problem is, five years after the end of the great recession, the bank statistics published in the Uniform Bank Performance Reports (“UBPR”) by the Federal Financial Institutions Examination Council (“FFIEC”) simply don’t support this idea that small town community banks are dead, or that they are even dying. As a matter of fact, there is some argument to the contrary, at least in certain contexts.
In reaching this conclusion, I examined the UPBR average peer group data from the last five years for each of the 15 major peer groups for insured commercial banks. I excluded the peer groups related to De Novo banks created in the last five years which had the potential to skew the analysis due to the unique challenges faced by De Novo institutions. These 15 different peer groups, which included 5,619 banks, are delineated as follows:
| Peer Group 1: Insured commercial banks in excess of $3 billion |
| Peer Group 2: Insured commercial banks between $1 billion and $3 billion |
| Peer Group 3: Insured commercial banks between $300 million and $1 billion |
| Peer Group 4: Insured commercial banks having assets between $100 million and $300 million, with 3 or more full service banking offices and located in a metropolitan statistical area |
| Peer Group 5: Insured commercial banks having assets between $100 million and $300 million, with 3 or more full service banking offices and not located in a metropolitan statistical area |
| Peer Group 6: Insured commercial banks having assets between $100 million and $300 million, with 2 or fewer full service banking offices and located in a metropolitan statistical area |
| Peer Group 7: Insured commercial banks having assets between $100 million and $300 million, with 2 or fewer full service banking offices and not located in a metropolitan statistical area |
| Peer Group 8: Insured commercial banks having assets between $50 million and $100 million, with 3 or more full service banking offices and located in a metropolitan statistical area |
| Peer Group 9: Insured commercial banks having assets between $50 million and $100 million, with 3 or more full service banking offices and not located in a metropolitan statistical area |
| Peer Group 10: Insured commercial banks having assets between $50 million and $100 million, with 2 or fewer full service banking offices and located in a metropolitan statistical area |
| Peer Group 11: Insured commercial banks having assets between $50 million and $100 million, with 2 or fewer full service banking offices and not located in a metropolitan statistical area |
| Peer Group 12: Insured commercial banks having assets less than $50 million, with 2 or more full service banking offices and located in a metropolitan statistical area |
| Peer Group 13: Insured commercial banks having assets less than $50 million, with 2 or more full service banking offices and not located in a metropolitan statistical area |
| Peer Group 14: Insured commercial banks having assets less than $50 million, with 1 full service banking office and located in a metropolitan statistical area |
| Peer Group 15: Insured commercial banks having assets less than $50 million, with 1 full service banking office and not located in a metropolitan statistical area |
As of December 31, 2014, the average number of banks per peer group was 374.6 banks. The largest peer group by far was Peer Group 3 (i.e., banks between $300 million and $1 billion), which included 1,254 banks. The smallest peer group was Peer Group 12 (i.e., banks less than $50 million located in a metropolitan area and having 2 or more full branches), which contained 63 banks. The median peer group was Peer Group 2 (i.e., banks between $1 billion and $3 billion) with 321 banks.
This UBPR data separates banks into peer groups that distinguish them not only on the basis of size, but also based upon the number of full service branches operated by a bank as well as whether the bank is located in a metropolitan or non-metropolitan area. For the purposes of clarification, it is important to note that a bank may be classified as a non-metropolitan bank and still have full service branches in a metropolitan area, and vice versa. For example, a $150 million commercial bank whose main office is in a non-metropolitan area but who also operates another full service branch in a metropolitan area is part of Peer Group 7, which includes banks between $100 million and $300 million of assets that have 2 or fewer branches and are not located in a metropolitan area. Therefore, it is the main office location of the bank that controls and not the location of its branches. For the purposes of the UBPR, a metropolitan area is one classified as a Metropolitan Statistical Area by the Office of Management and Budget.
I first stumbled upon the truths presented by the UBPR while I was analyzing the performance data of a client. With the same prejudices in mind that I stated in the opening two paragraphs, I decided to compare that bank’s data to statistics for banks in “larger” peer groups. What I discovered astonished me and interested me to the point that I decided to dig deeper. Not only did the bank’s statistics compare more favorable to the data of “larger” peer groups than it did to statistics of its own peer group, but the average numbers for the bank’s peer group 7, which is assigned to relatively smaller, rural banks, seemed to soar well above some of its larger, more metropolitan cousins.
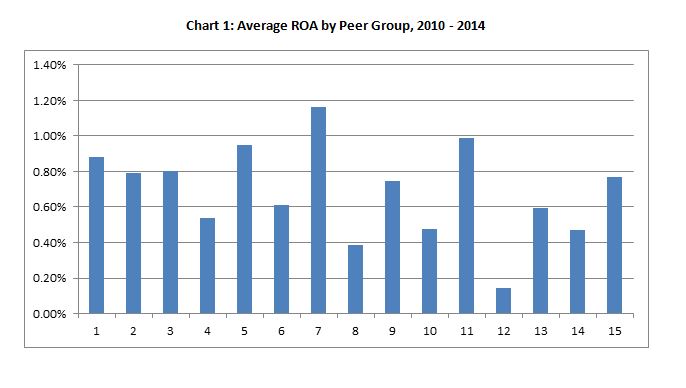
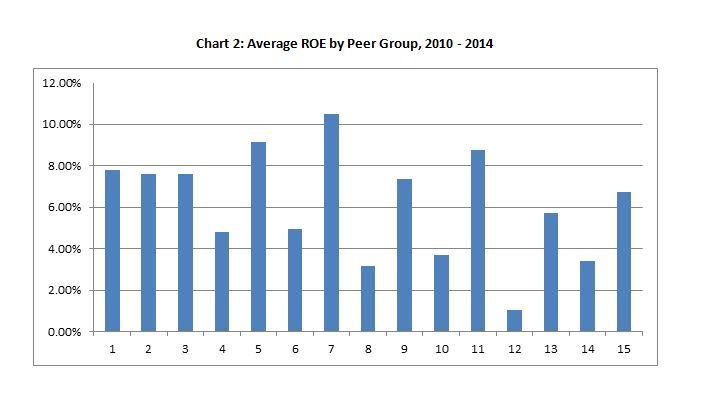
Peer group 7, which, as mentioned above, is reserved for banks between $100 million and $300 million in assets that are located in a non-metropolitan area and have 2 or fewer branches, averaged the highest Return on Equity (“ROE”) (i.e., 10.47%) and Return on Assets (“ROA”) (i.e., 1.16%) of any peer group over the last five years. What about the next highest ROE and ROA? Well those belonged to “rural, community” banks as well. Peer Group 11 (i.e., $50 million to $100 million, 2 or fewer branches, and non-metropolitan area) boasted the next highest ROA of 0.99%, and Peer Group 5 (i.e., $100 million to $300 million, 3 or more branches, and non-metropolitan area) claimed second place in ROE with 9.12%. Third place in each category also belonged to Peer Groups 11 and 5, just in reverse with respect to the category. Peer Group 1, the peer group for the nation’s largest banks (i.e., more than $3 billion in assets), doesn’t show up on either list until you look down to fourth place, where it finished with an average ROE of 7.79% and an average ROA of 0.88% over the last five years. In my next post, we will start to examine what could be the explanation of this and what secrets it could reveal to you regarding operating a community bank in this challenging environment.